Parcel_value_app
The value of standardizing value by area
Some screenshots are taken from older versions of the dashboard. The dashboard shows value/sqft of every taxable parcel in San Diego County. Why value/sqft instead of just value? Because land is the most important resource for the government and we measure yield within a standardized area. To illustrate the immense differences in value/sqft, I will compare the most expensive mansion in La Jolla and a Section 8 housing unit that used to be “where you bought weed”.
Foxhill Estates is the most expensive property in La Jolla, spanning over 30 acres and just sold at $35 million. That means it is assessed at $25/sqft. In contrast, Meadowbrook Apartments in Bay Terrace is a Section 8 housing unit that houses more than 200 households. It used to be a very sketchy place, albeit in the past 10 years it has been improving. It is assessed at $65/sqft - 280% that of Foxhill Estate’s. Therefore for the public to evaluate the efficacy of land, just looking at market or assessed value is not enough. The value must be standardized by area for it to be meaningful.
I am using this methodology to write a paper on how high residential water usage and low property tax efficiency are connected in San Diego.
I have given the dashboard a custom domain: https://www.sdparcelmap.com.
How to use the app
1. Basics
When you open the link, the website looks like this:
 If you directly click
 Show Map, the following message will pop up:
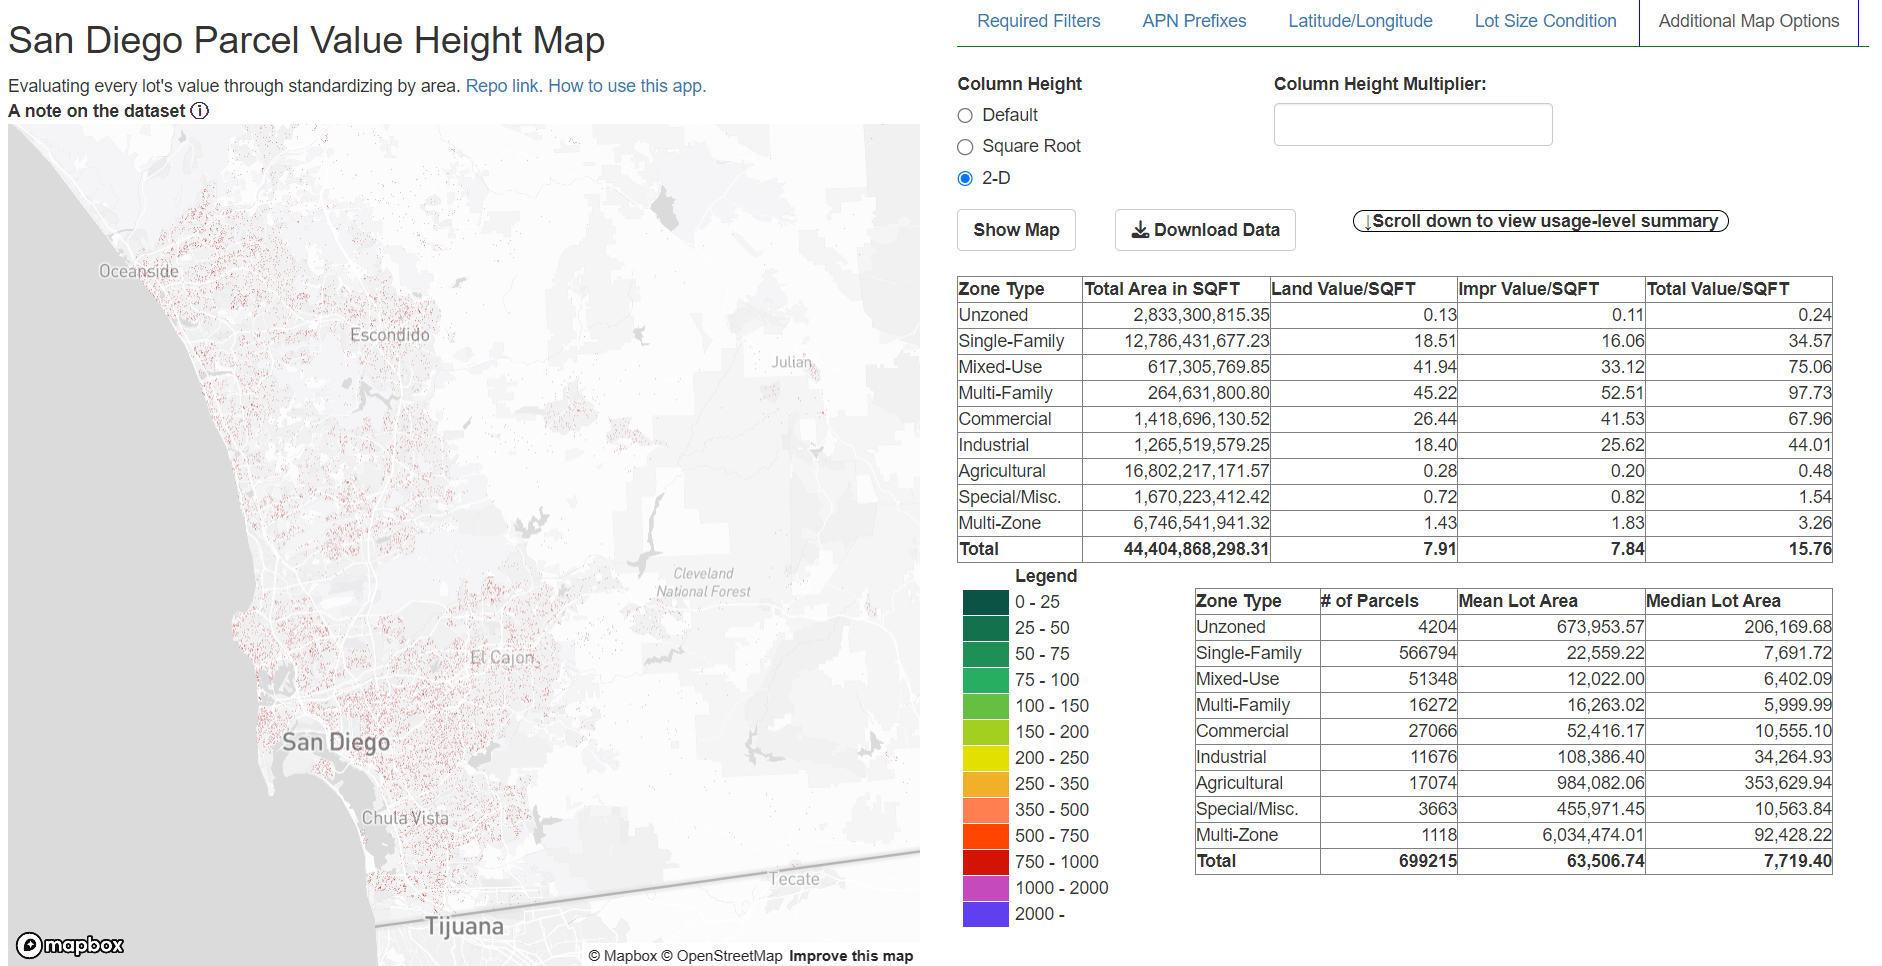
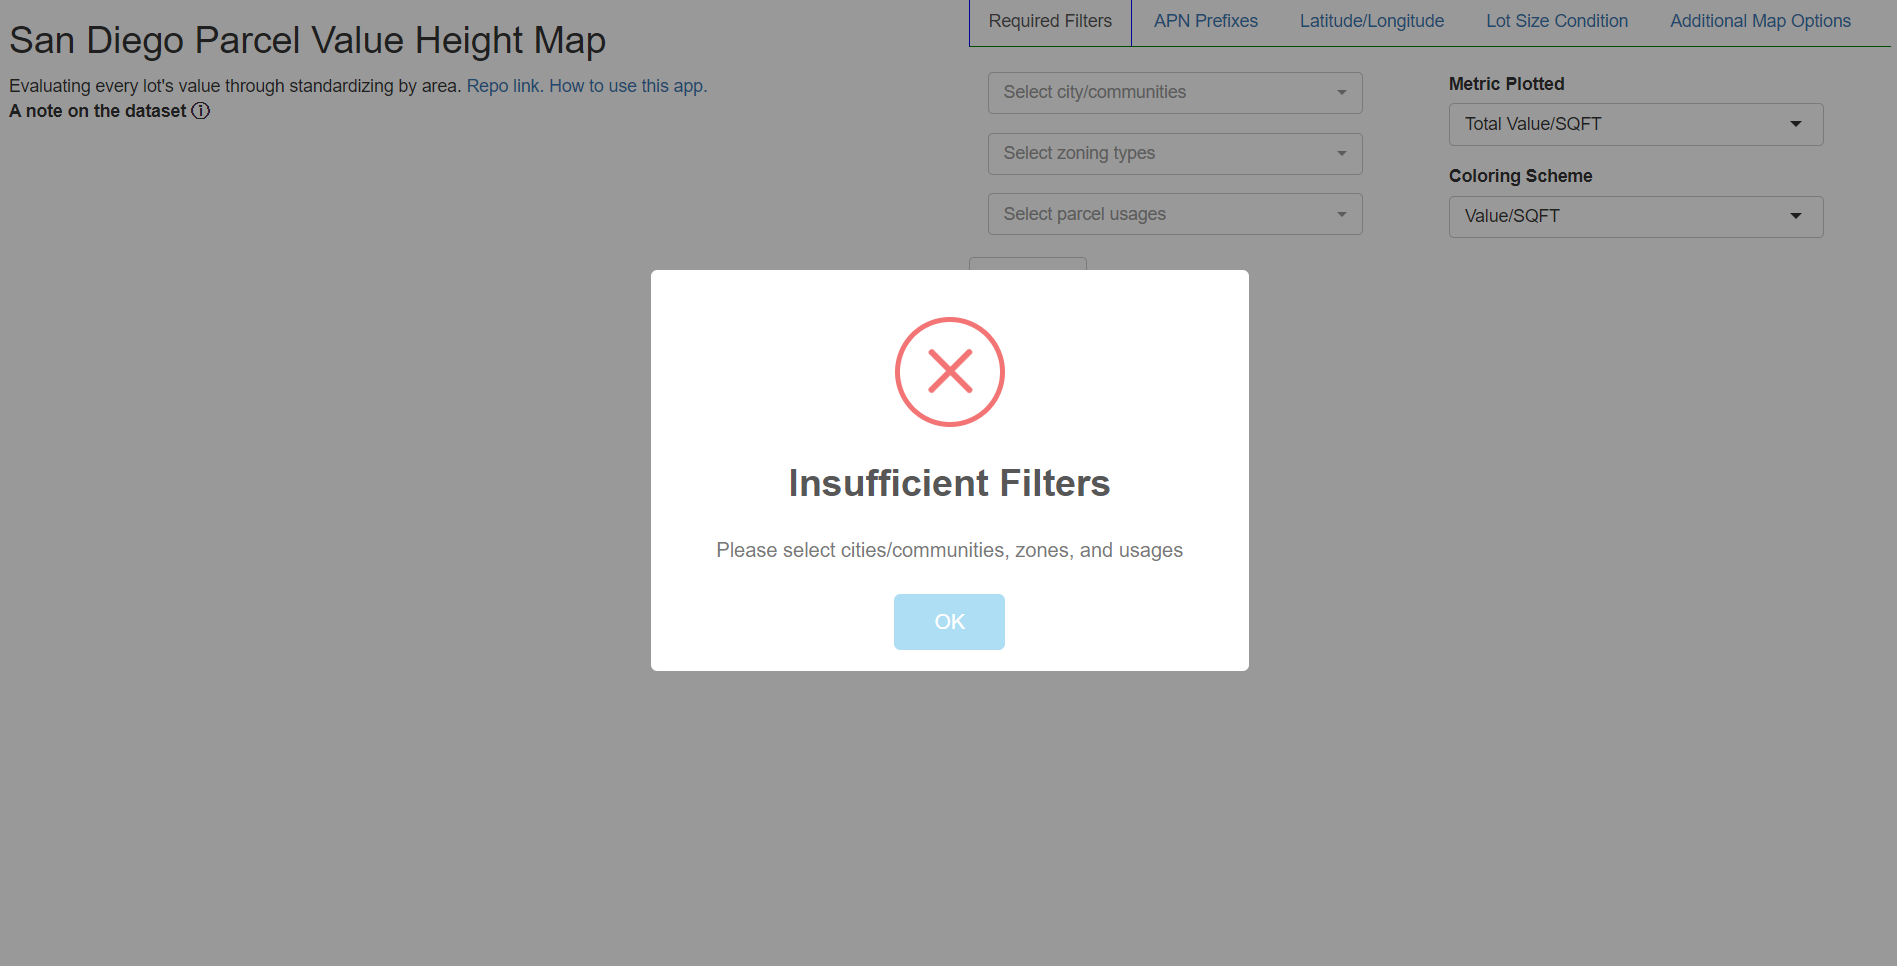 You will need to select the city/community, zoning, and usages to map. These are the required filters. For example, the following image shows the results for selecting parcels from every community, zoning type, and parcel usage (the entire county):
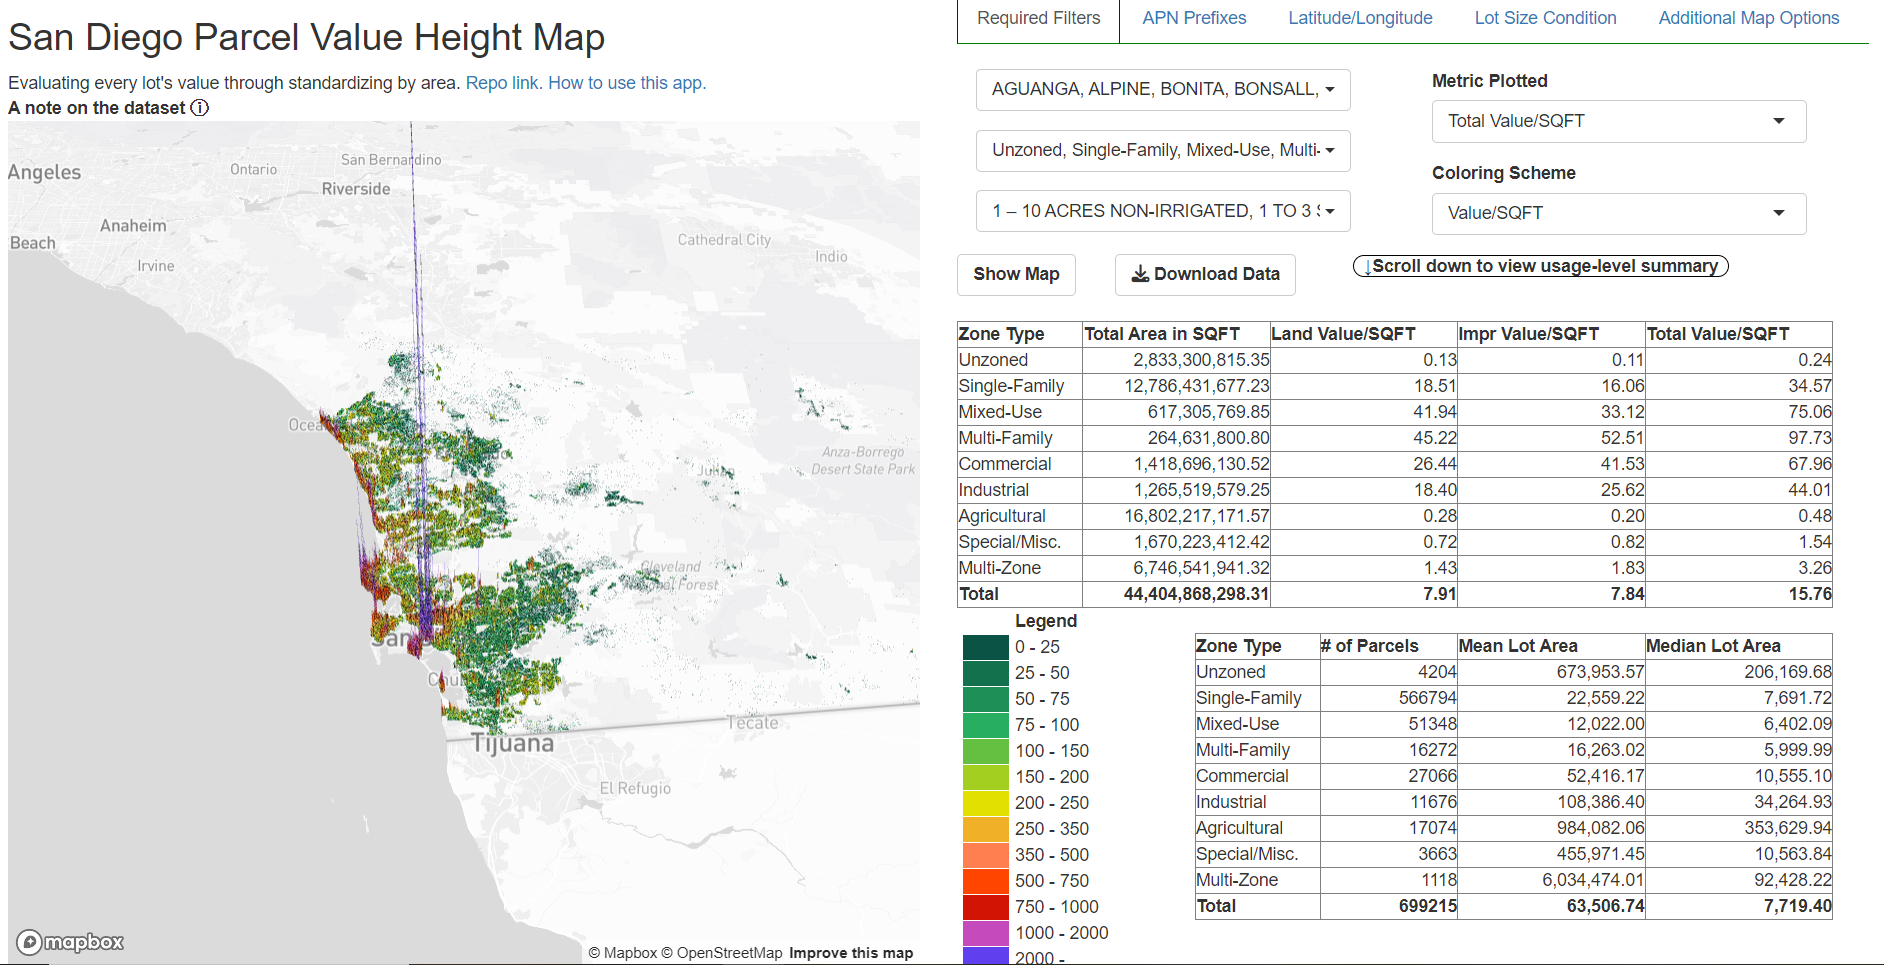 The left side is the map, while the right side includes summary statistics for every zoning type.
The following cities/communities are included in the SANDAG dataset:
The left side is the map, while the right side includes summary statistics for every zoning type.
The following cities/communities are included in the SANDAG dataset:
AGUANGA, ALPINE, BONITA, BONSALL, BORREGO SPRINGS, BOULEVARD, CAMP PENDLETON, CAMPO, CARDIFF BY THE SEA, CARLSBAD, CHULA VISTA, CORONADO, DEL MAR, DESCANSO, DULZURA, EL CAJON, ENCINITAS, ESCONDIDO, FALLBROOK, GUATAY, IMPERIAL BEACH, JACUMBA, JAMUL, JULIAN, LA JOLLA, LA MESA, LAKESIDE, LEMON GROVE, LEUCADIA, MOUNT LAGUNA, NATIONAL CITY, OCEANSIDE, OCOTILLO, OLIVENHAIN, PALA, PALOMAR MOUNTAIN, PAUMA VALLEY, PINE VALLEY, POTRERO, POWAY, RAINBOW, RAMONA, RANCHITA, RANCHO SANTA FE, SAN CLEMENTE, SAN DIEGO, SAN MARCOS, SAN YSIDRO, SANTA YSABEL, SANTEE, SOLANA BEACH, SPRING VALLEY, TECATE, VALLEY CENTER, VISTA, WARNER SPRINGS
The Download Data button allows you to download statistics for every parcel mapped. In the previous case of the entire San Diego County, you will get more than 700,000 rows.
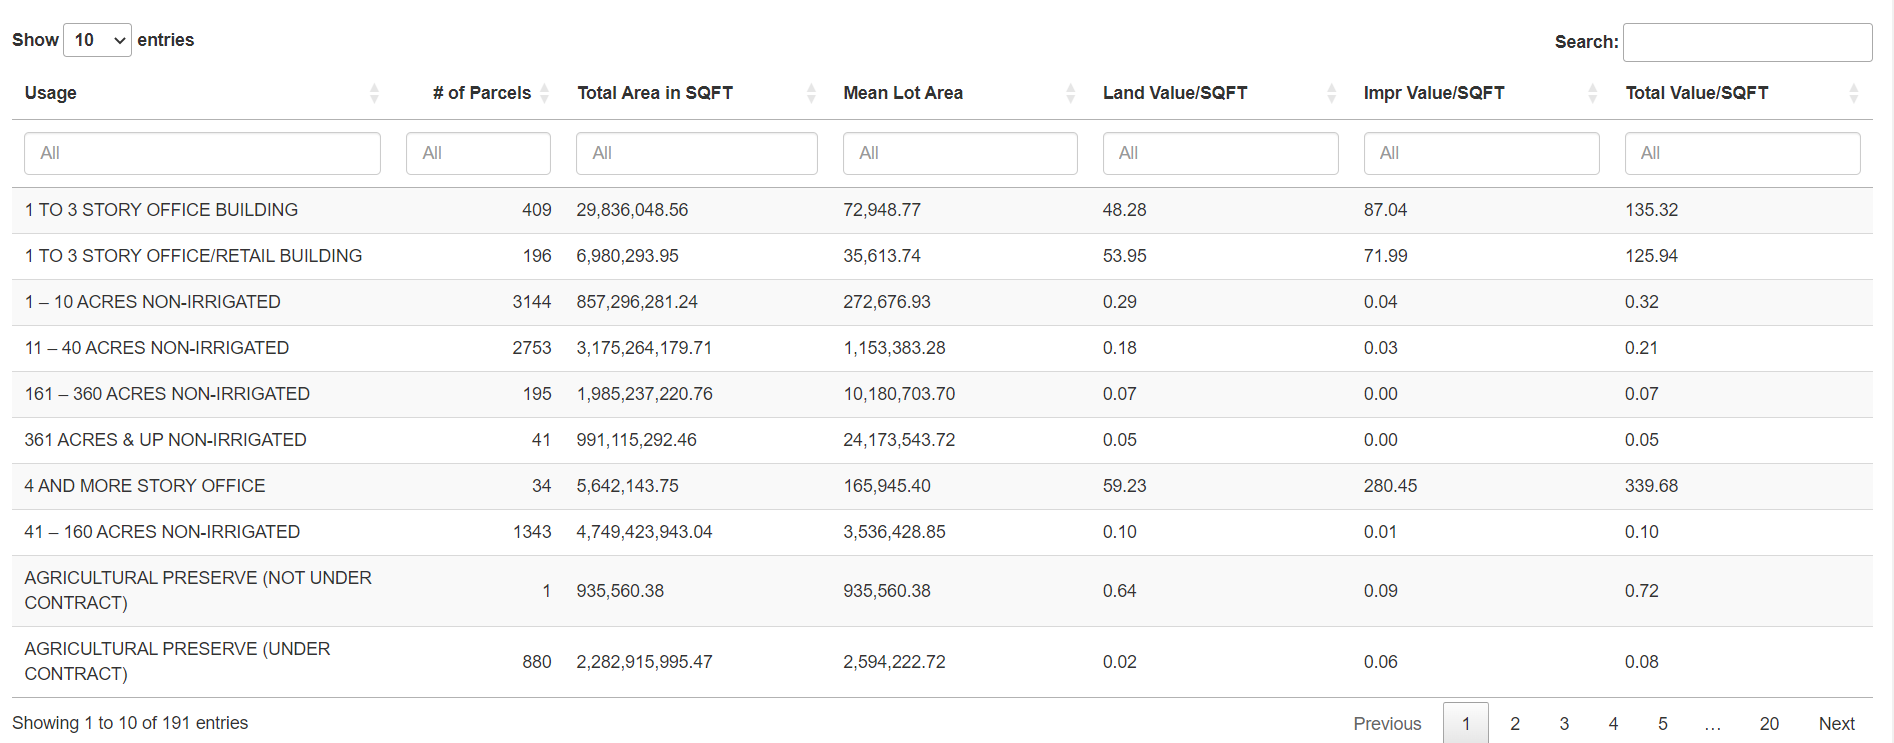
The tooltip also tells you that scrolling down gives the summary statistics for every usage type.
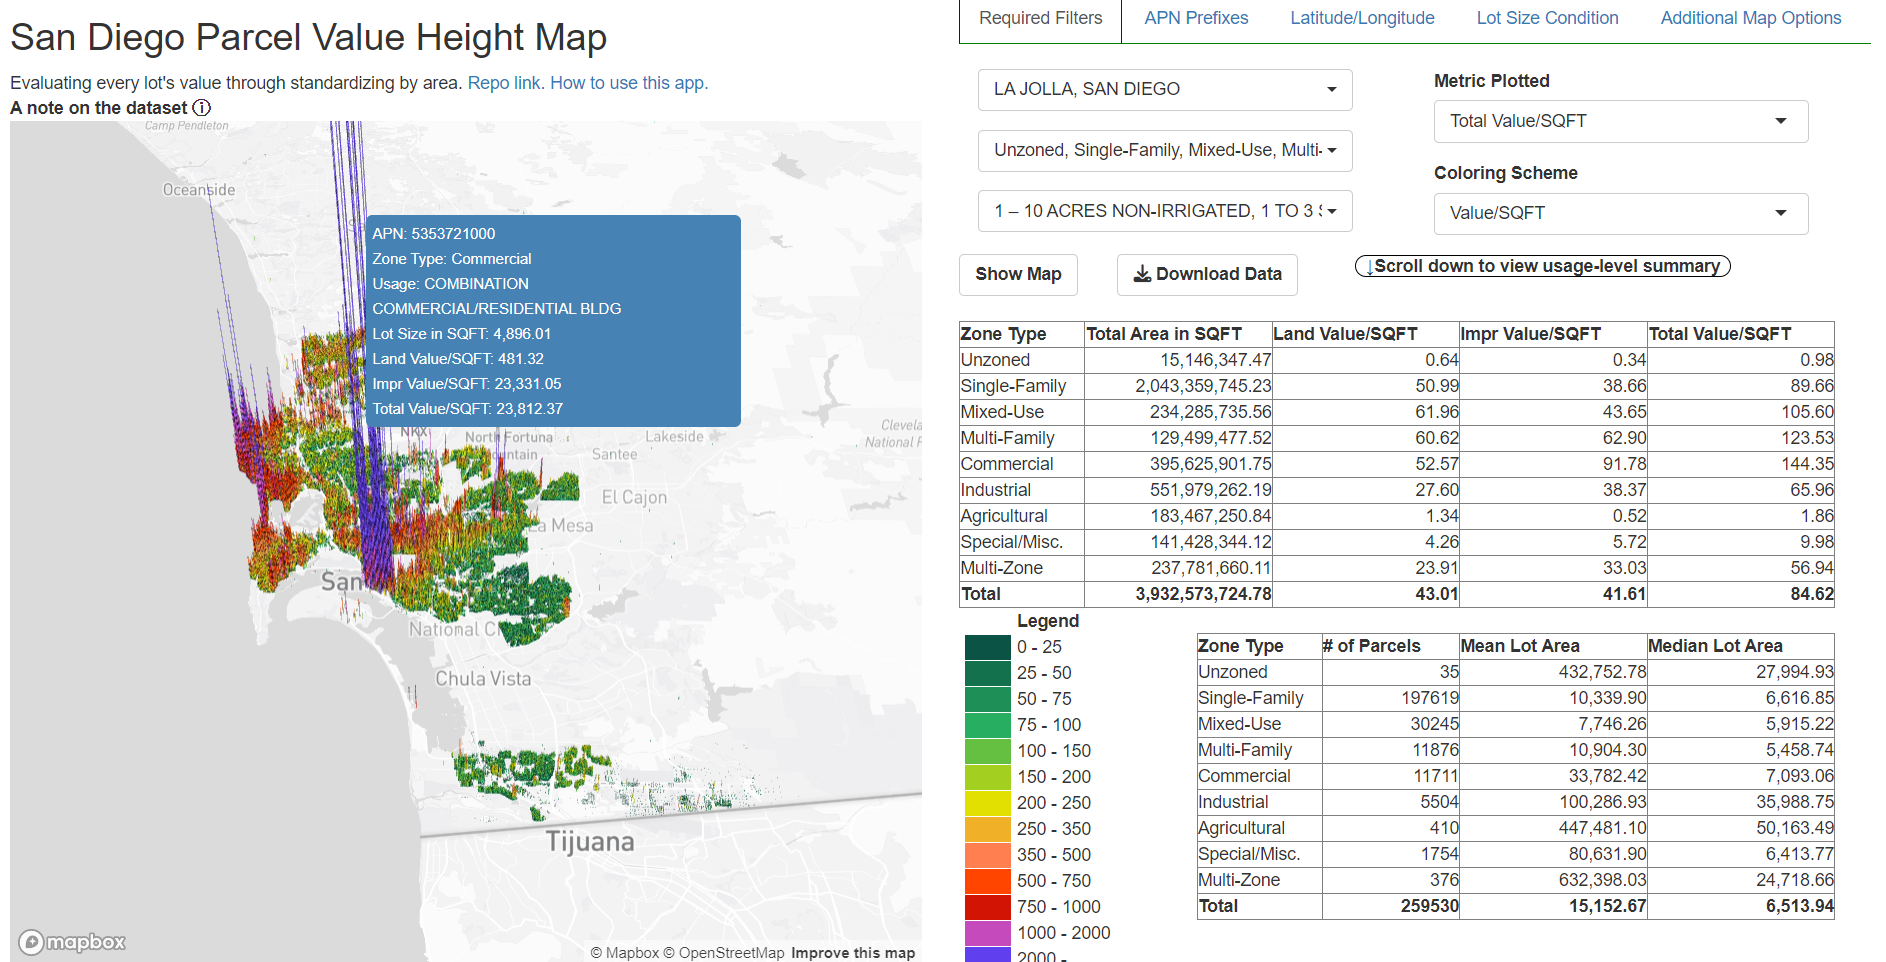
 Hovering over a column will show you information about that parcel:
 This will allow you to use the app directly. However, I have included additional functionality to select parcels more precisely.
2. APN Prefixes
Every parcel in San Diego is assigned a 10-digit APN. Some parcels include many subparcels (for example, condo buildings will have as many subparcels as there are units), and in that case the APN that I will use will be the range; for example, a 10-subparcel lot with subparcels 0000000001, 0000000002, …, 0000000010 will be assigned APN 0000000001-0000000010.
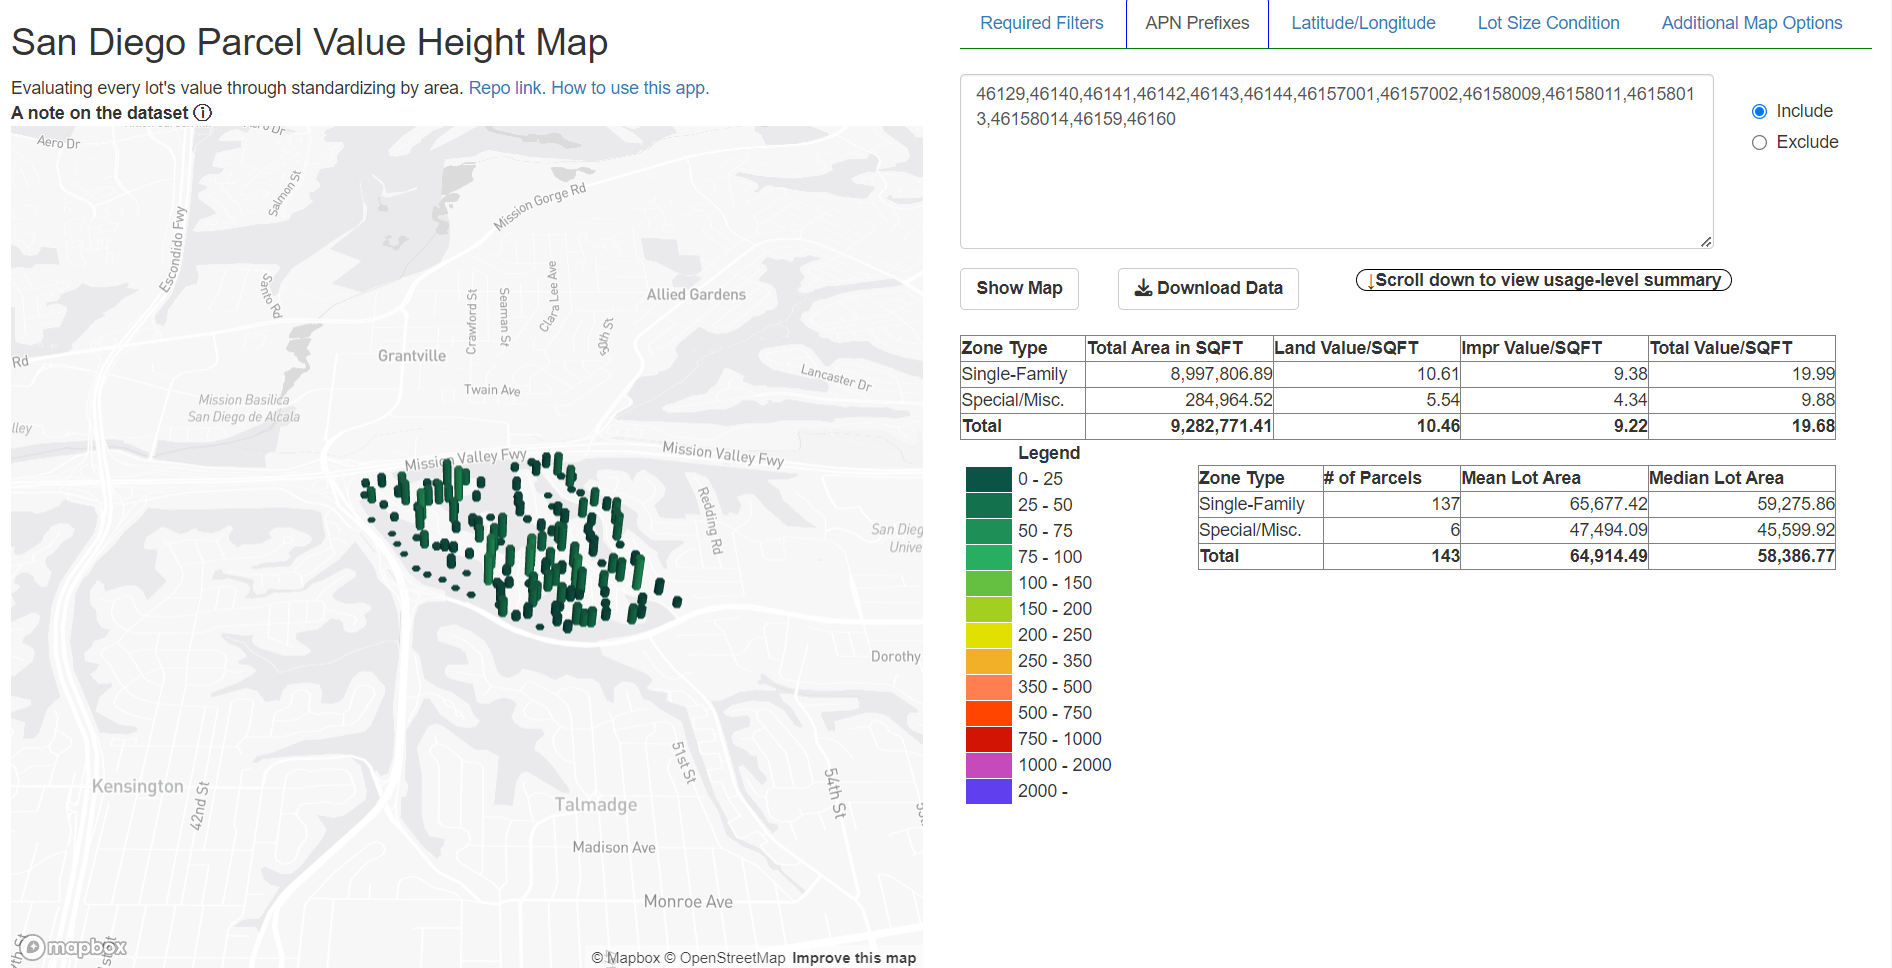
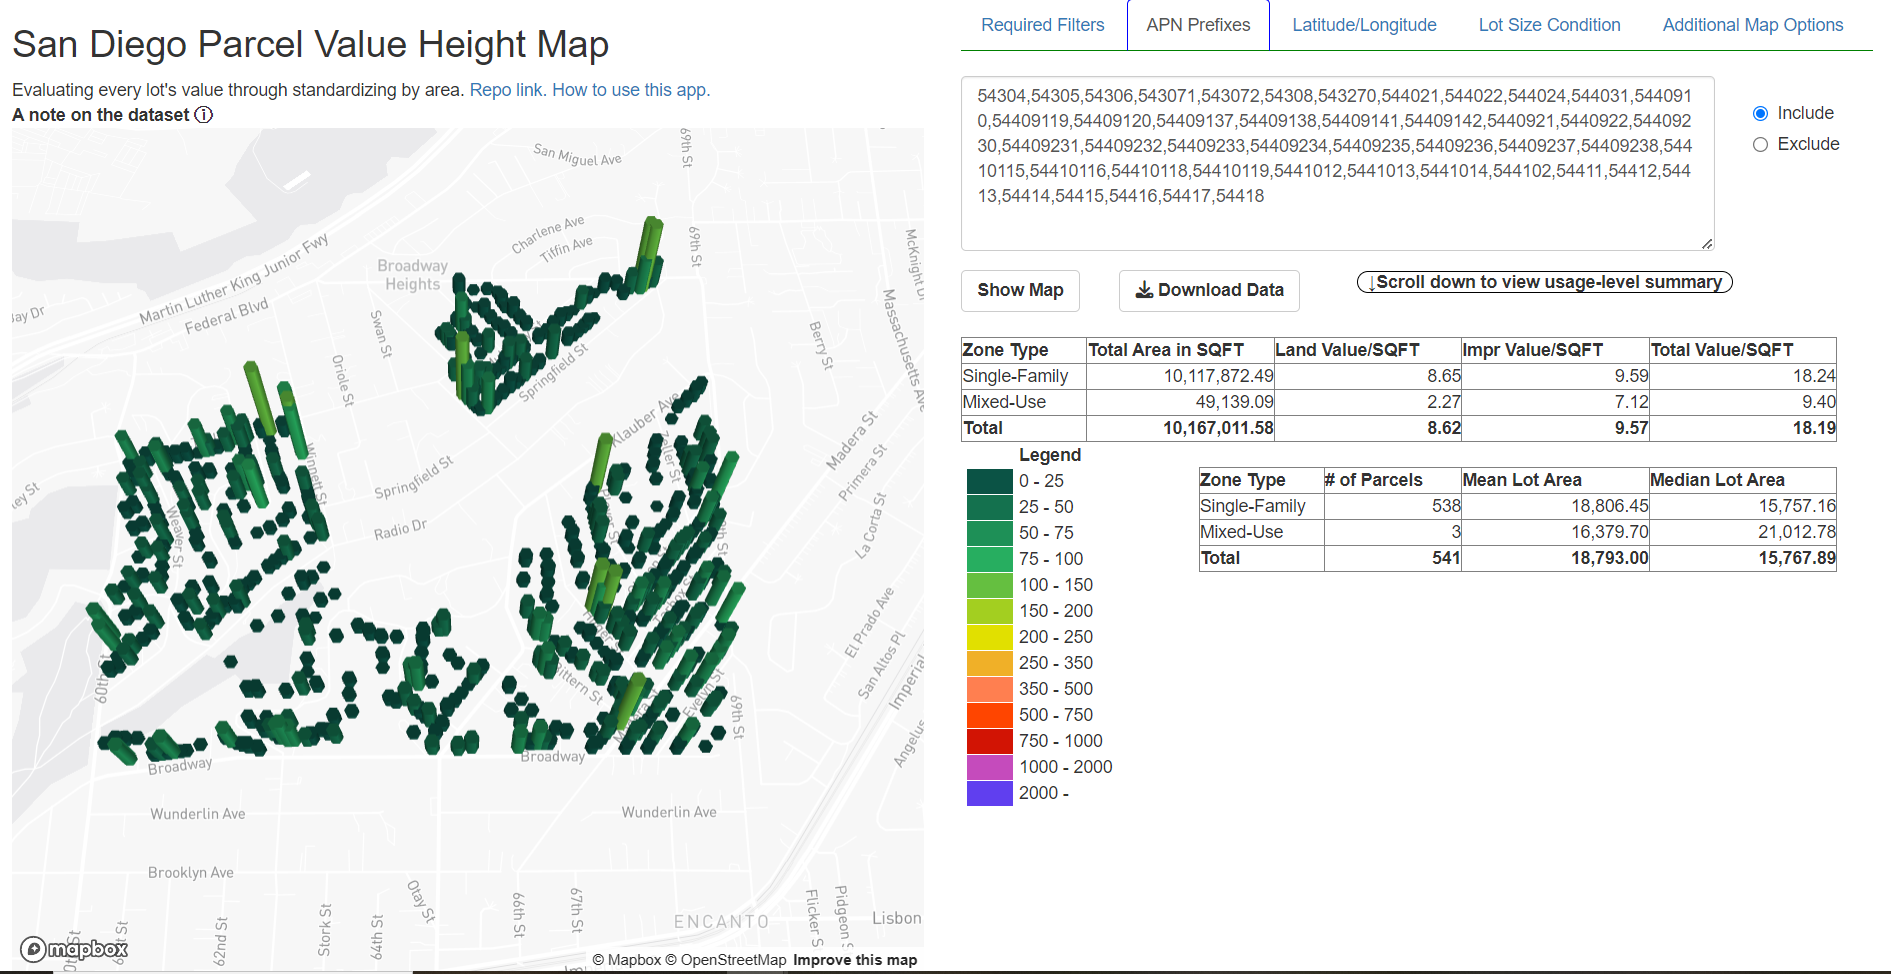
The dashboard provides a way to filter through APN prefixes. The APN prefixes can be of any length and must be separated by commas. Use SANDAG’s Parcel Lookup Tool to find APNs of specific parcels. Here is an example for Alvarado Estates:
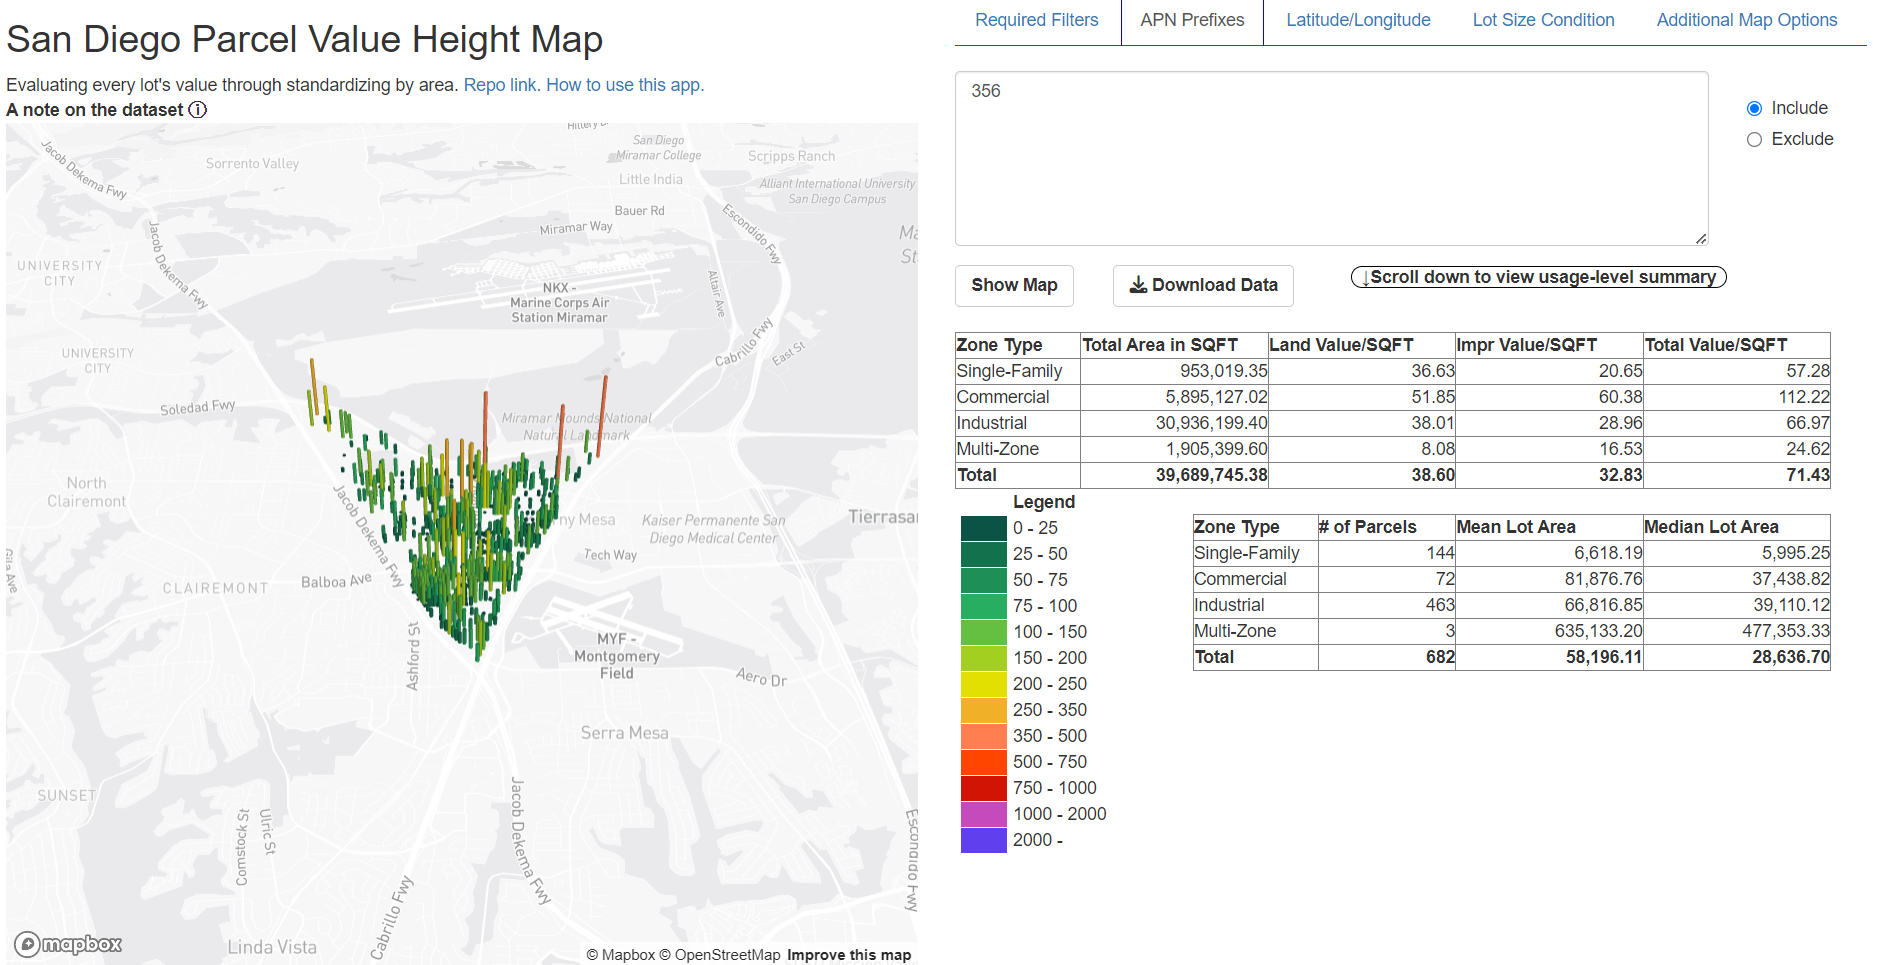
 Another example for Convoy district. All parcels in Convoy have an APN that start with 356:
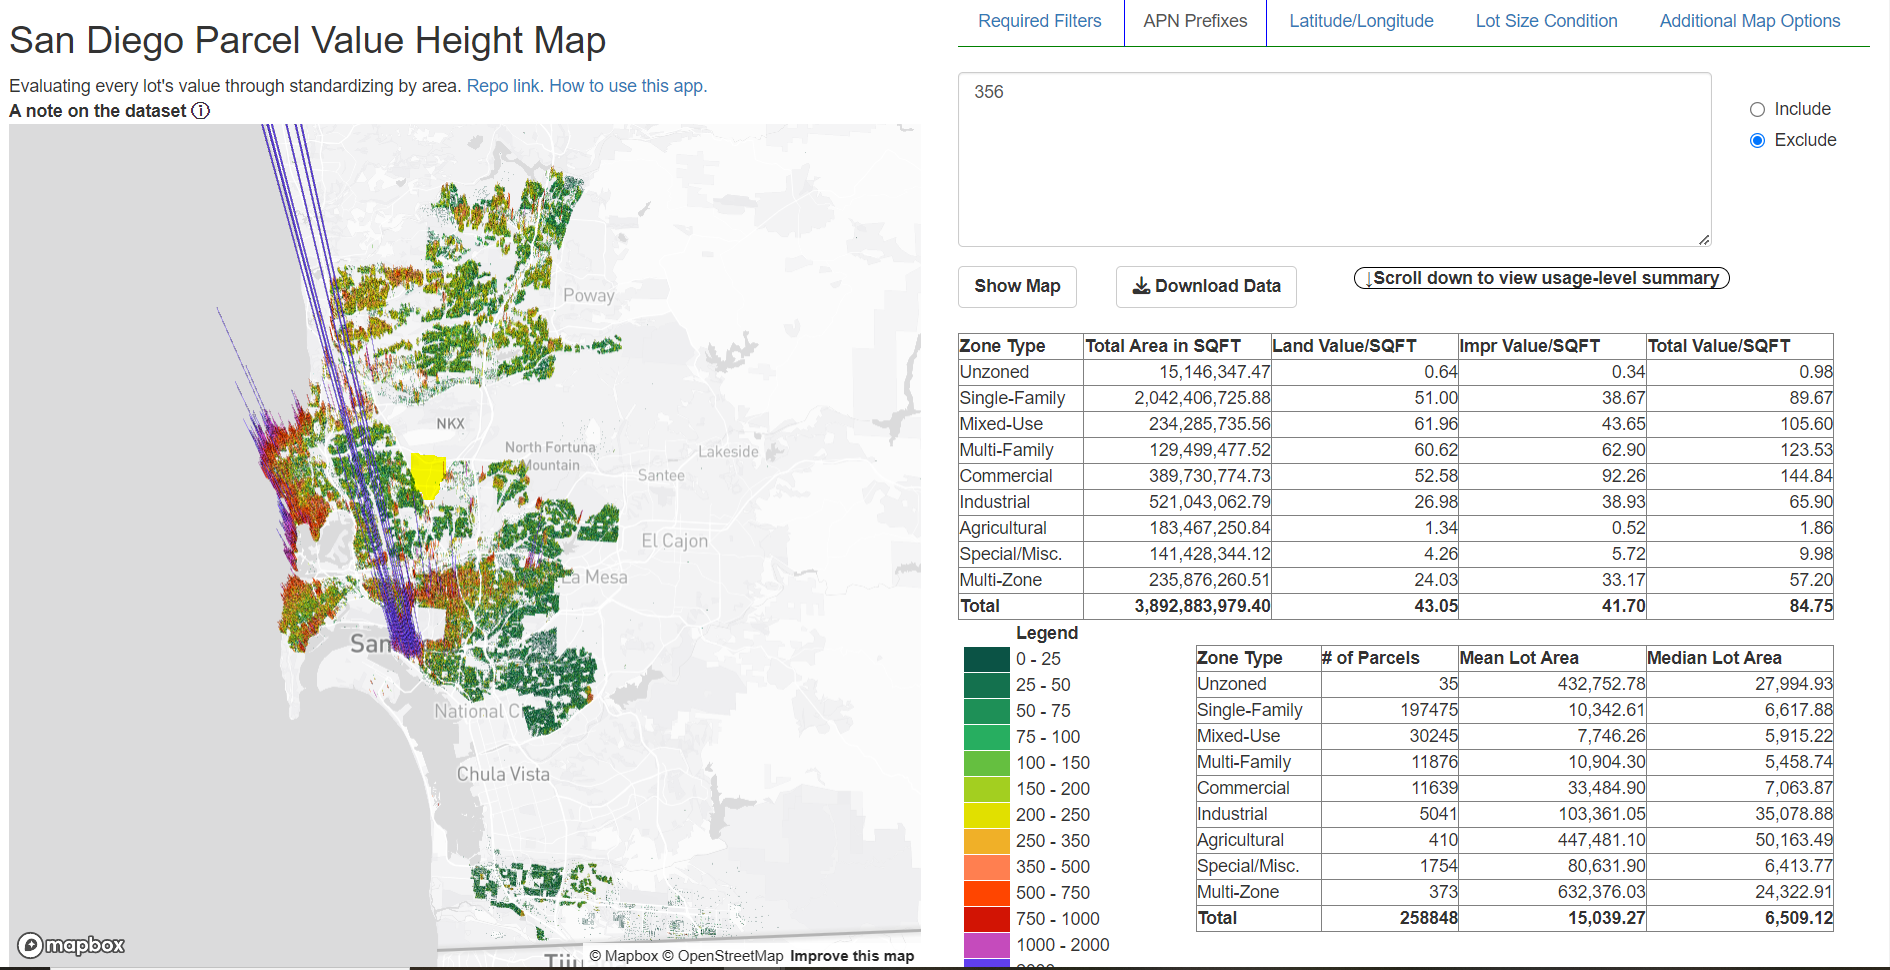
 Selecting “exclude” will show every parcel except those with the corresponding prefixes. The following example excludes all parcels in Convoy (highlighted area is the location of Convoy):
3. Latitude/Longitude
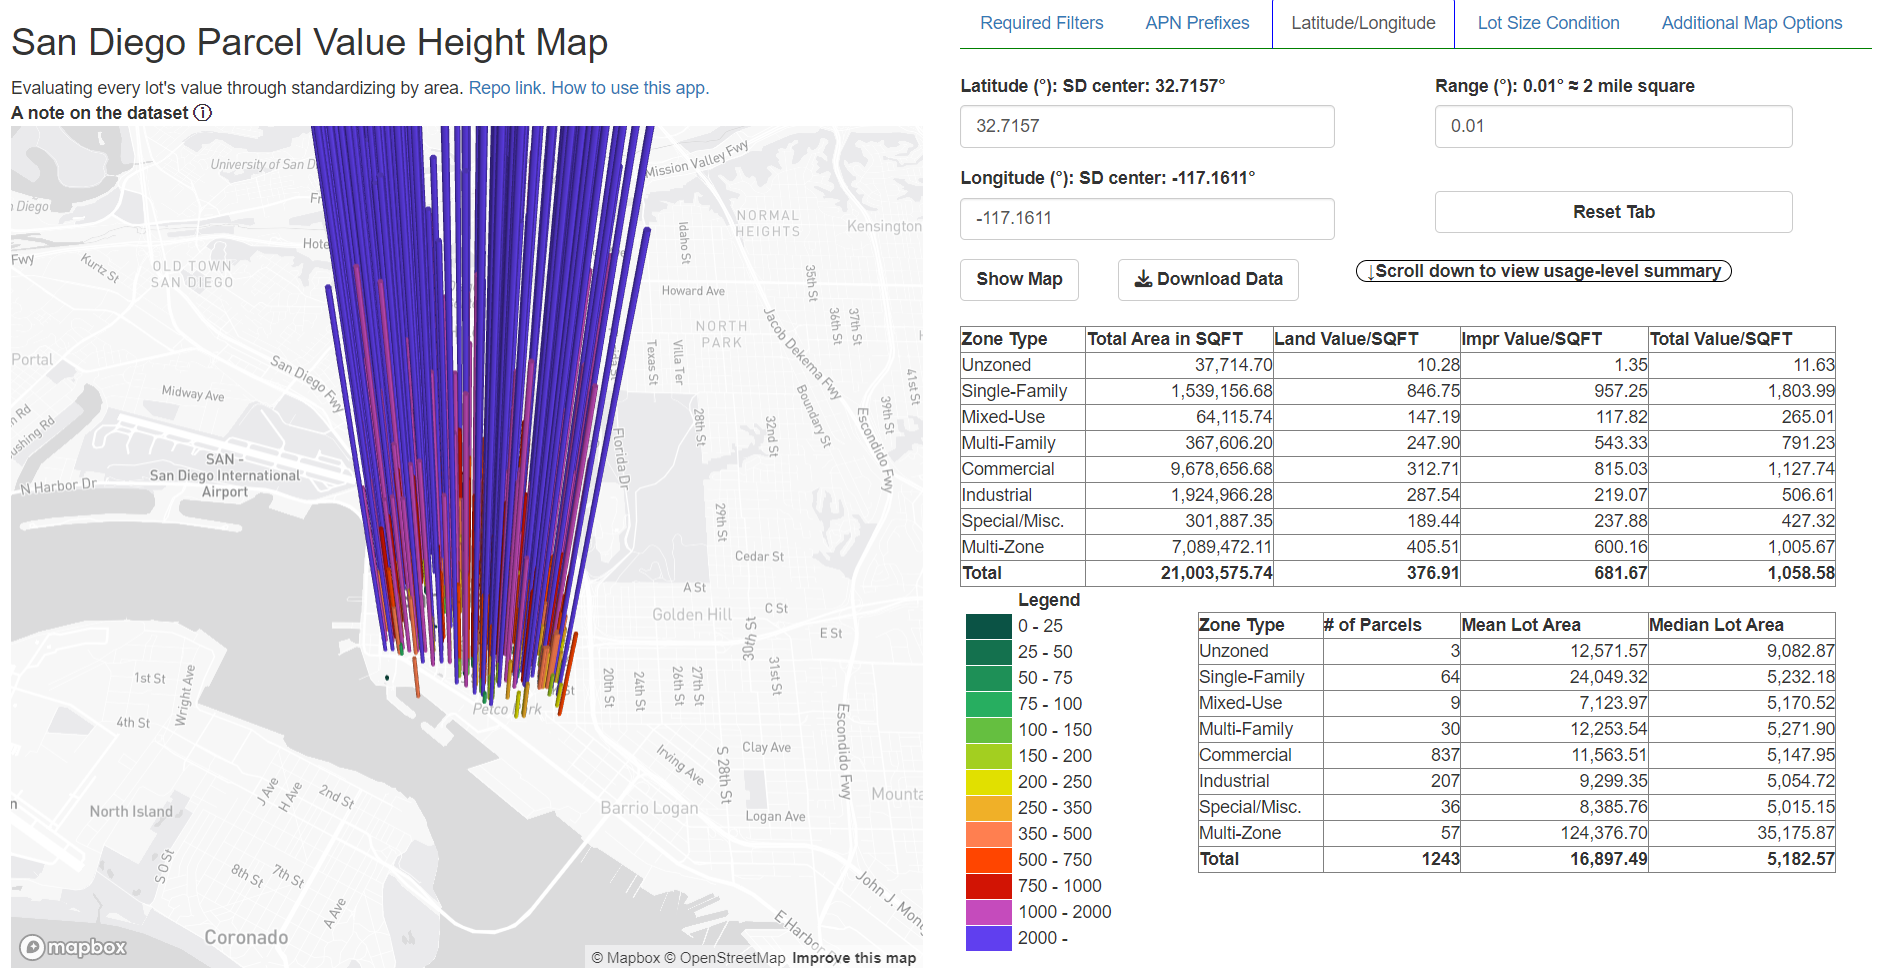
The dashboard allows for quick results by showing all parcels in a certain range of a given coordinate represented in Latitude and Longitude. All entries are in degrees. For example, San Diego’s centroid is (32.7157, -117.1611) and 0.01 degrees in difference is around 1 mile, making the area selected being a 2 mile $/times$ 2 mile square. The resulting map is a good approximation of downtown San Diego:
4. Lot Size Condition
For people interested in lot sizes. Both minimum and maximum lot size conditions can be added.
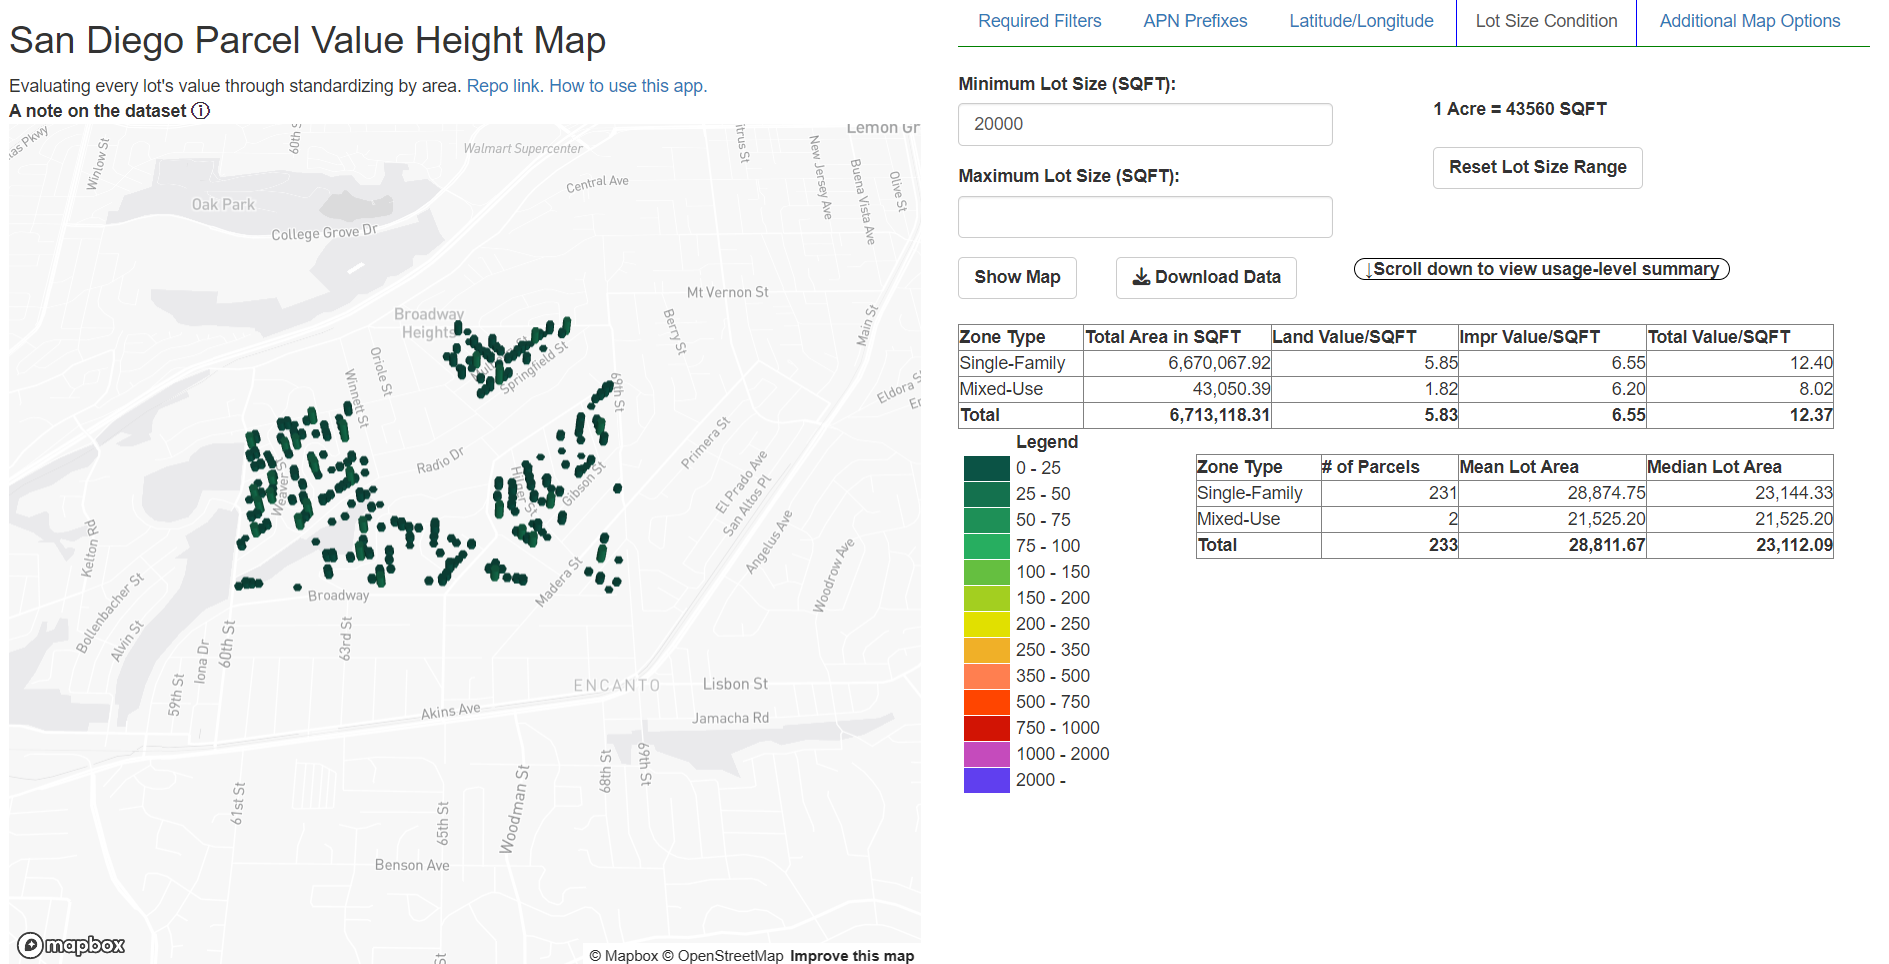
For example, Encanto recently revolted over the city footnote to change RS-1-2 (single family home lot with at least 20,000 sqft lot size) to RS-1-7 (single family home lot wit at least 5,000 sqft lot size), forcing the city to return the area to a RS-1-2 zoning.
The RS-1-2 zones in Encanto covera round 541 single family homes.
 Only 233 of these, or 43% of them have a lot size of over 20,000 sqft. Encanto is revolting so their homes are illegal again.
5. Additional Map Options
There are two ways to enhance readability of the maps: changing map mode and map height multipliers.
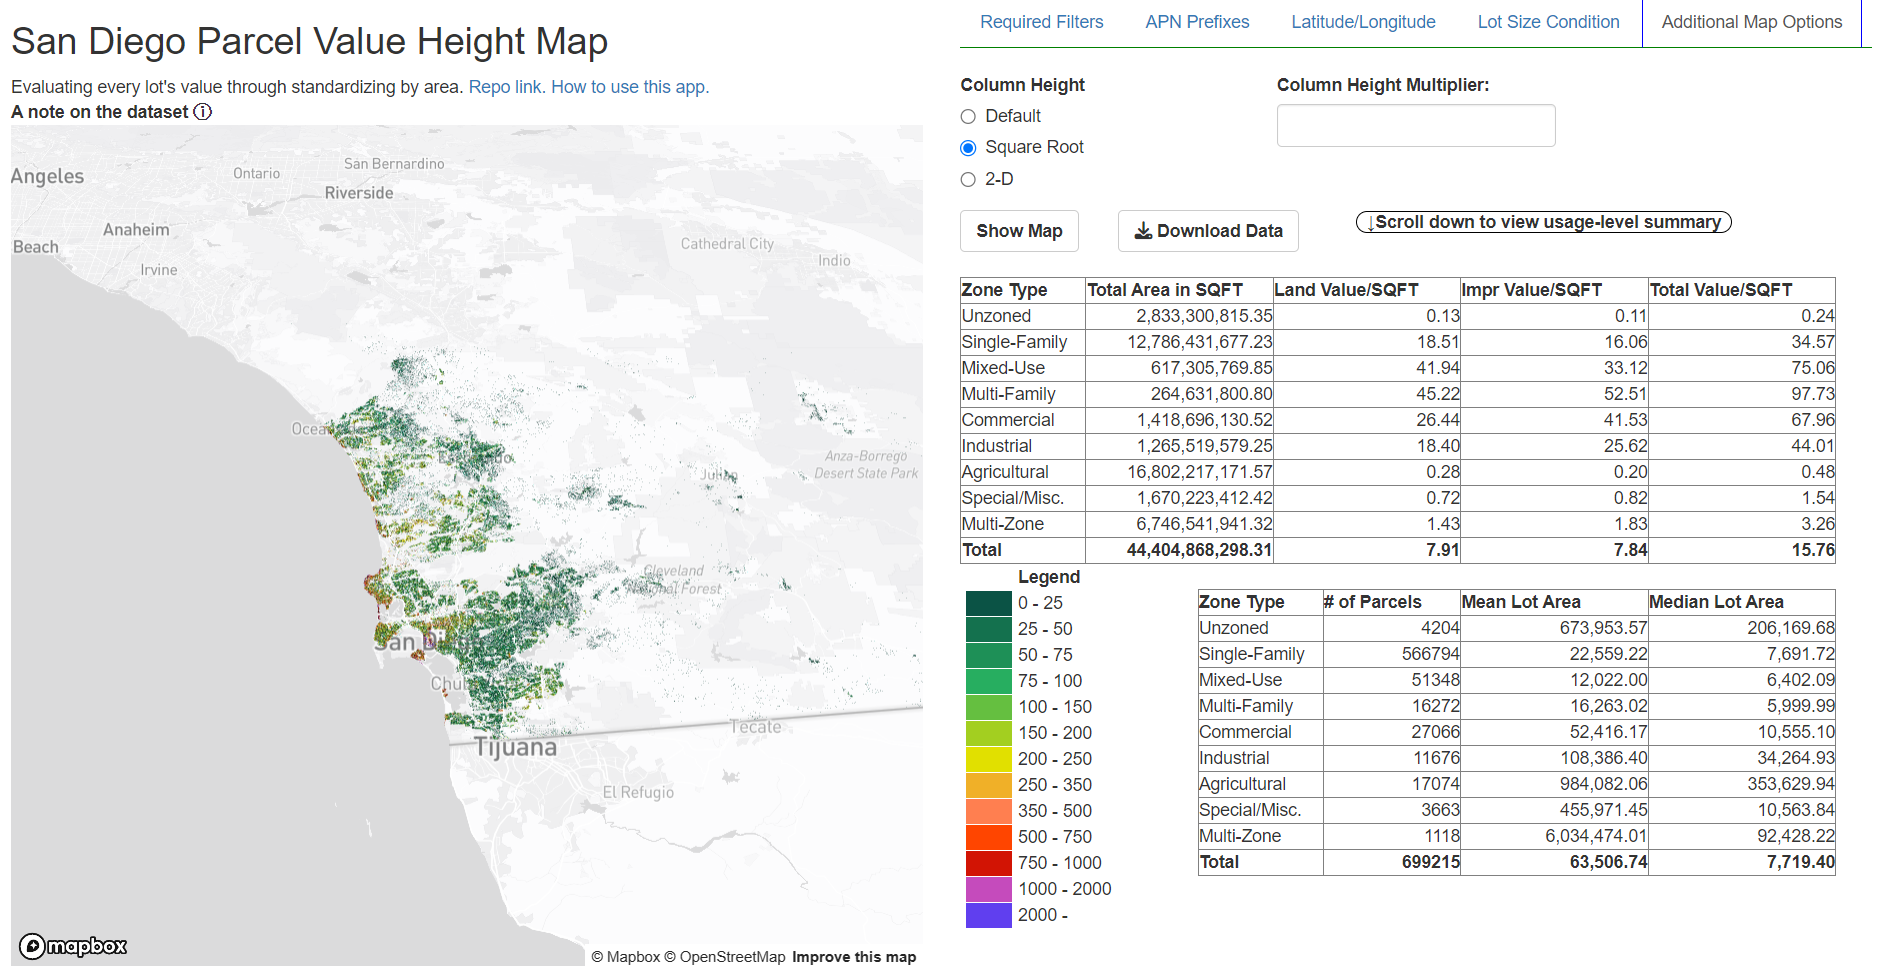
There are three map modes: the default option which plots the value/sqft as height, the square root option which plots the square root of the value/sqft as height, and the 2d option which plots every parcel in a same height plot:
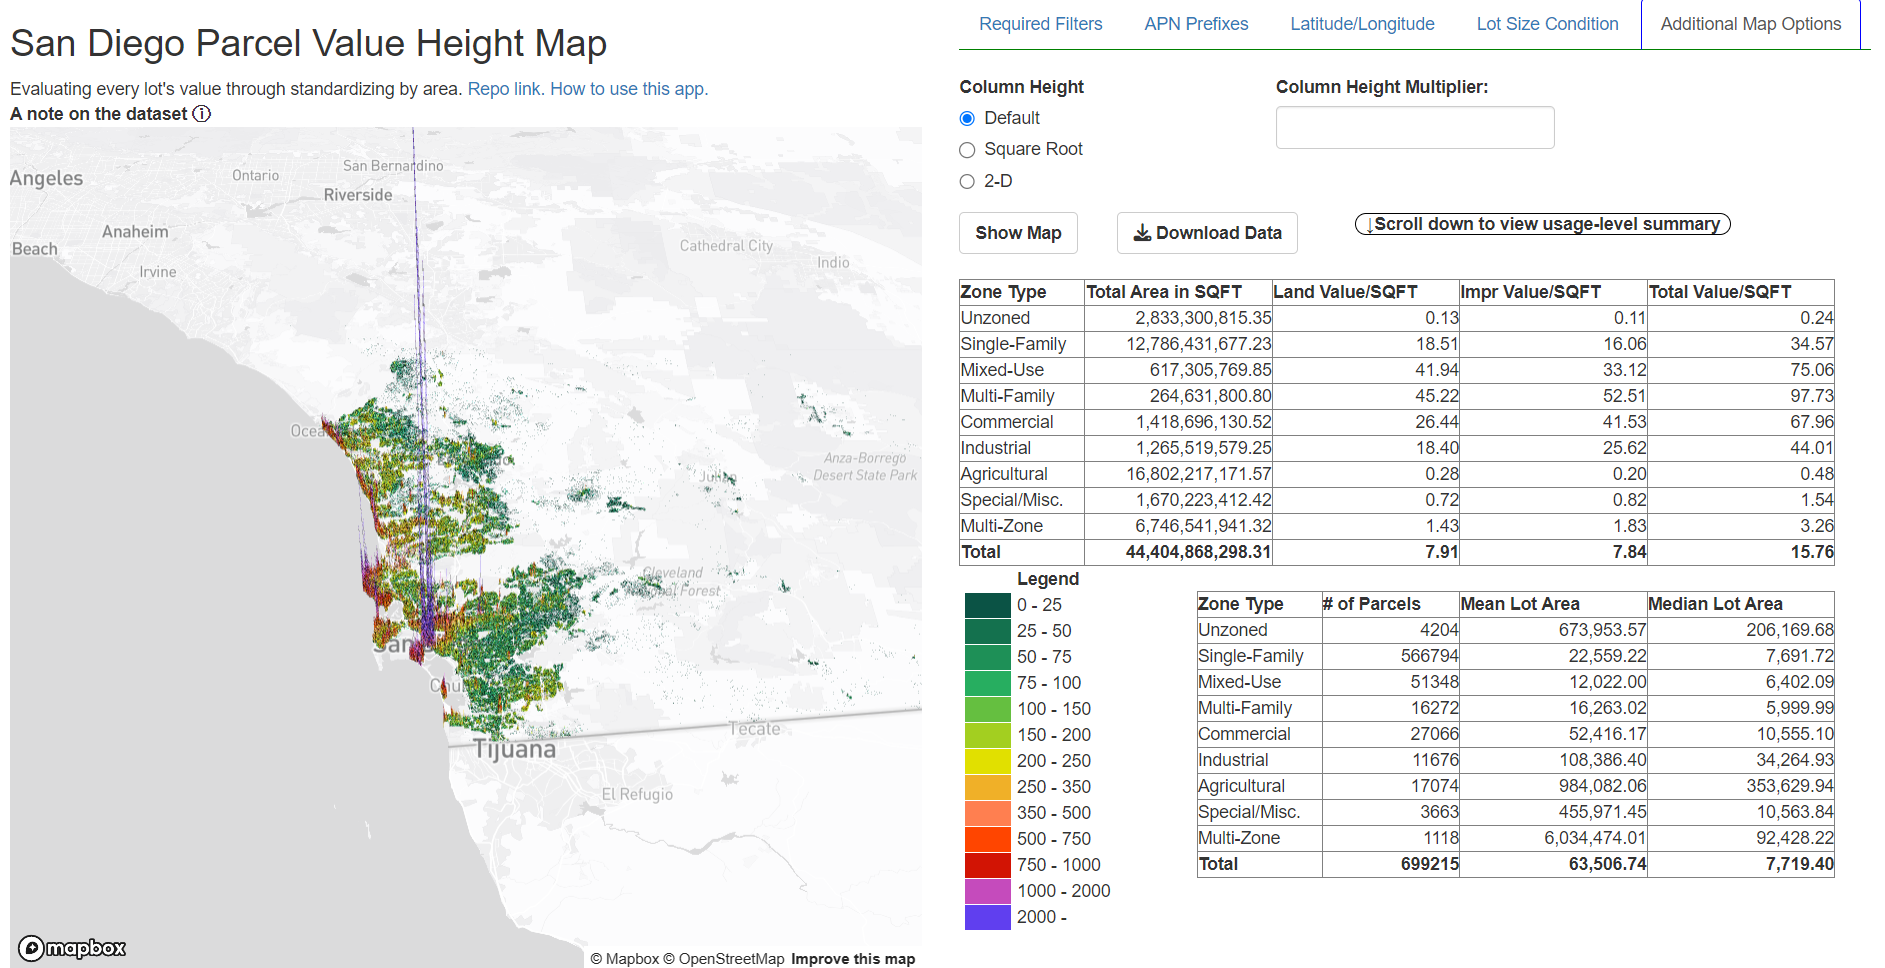
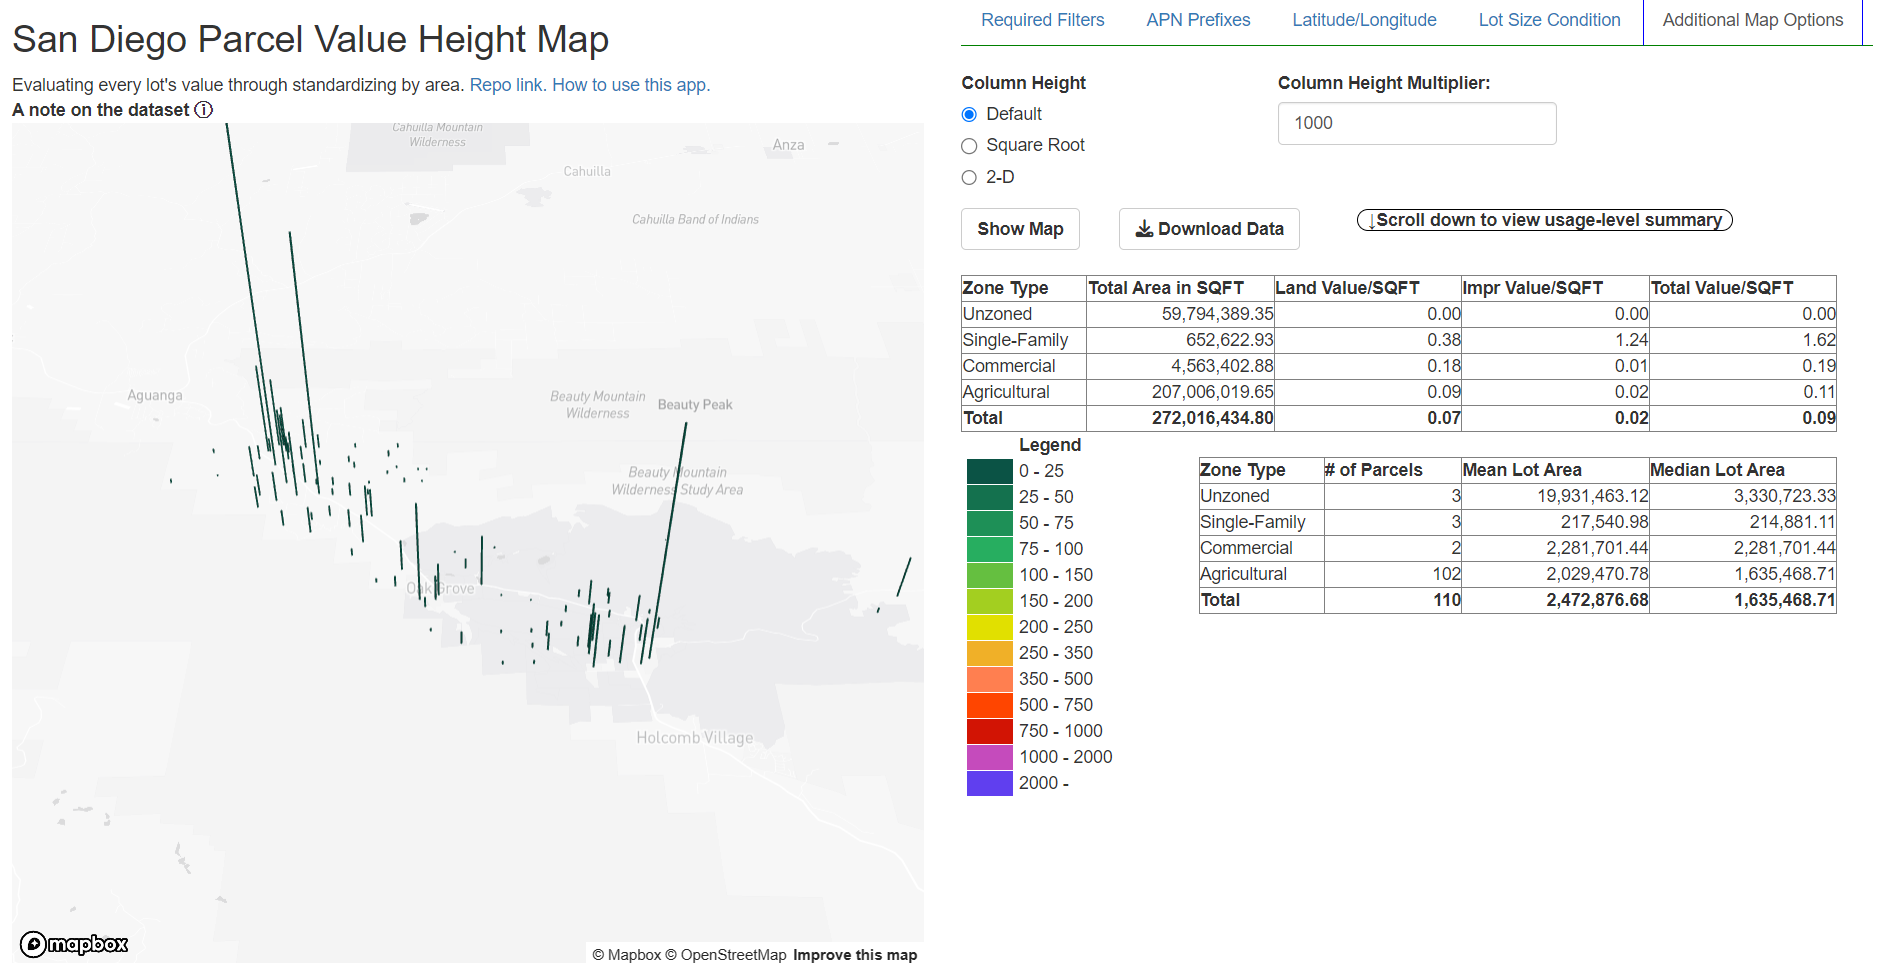
The map height multiplier option further inflates or deflates column height (applies for all three modes). For example, the default version of an Aguanga map is hard to read:
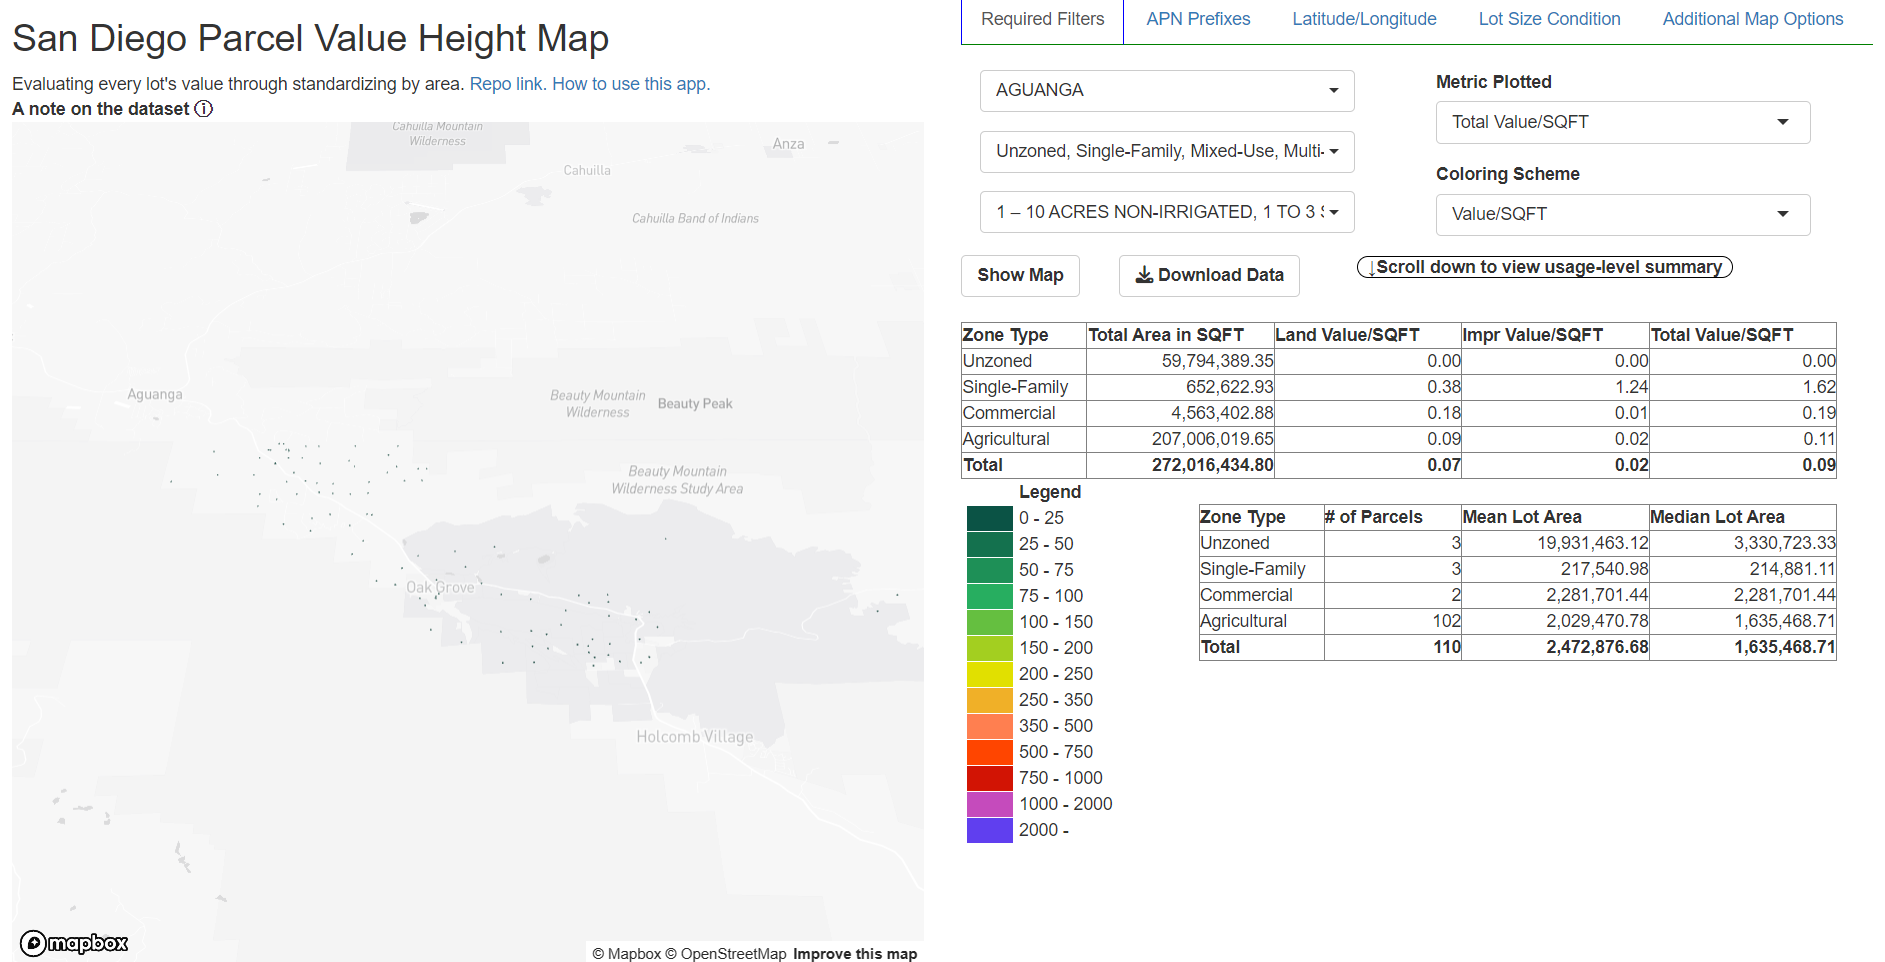
Applying a height multiplier of 1000 makes it much easier to view:
How to load the app in local
This app requires Shiny to run in local.
I recommend using RStudio to run most R tasks, since RStudio integrates so well with many of the core functionalities of the language (I prefer VIM for other languages so that tells you a lot about how great RStudio is).
Once you download RStudio, download the required libraries in ui.R and server.R (including shiny) (or use the renv.lock file to download the environment - requires renv package). Click the Run App button in the RStudio interface.
Further examples of what you can do with the app:
1. Rancho Santa Fe analysis
Rancho Santa Fe is the most affluent neighborhood in San Diego county. Are their houses as wealthy as we think they are?
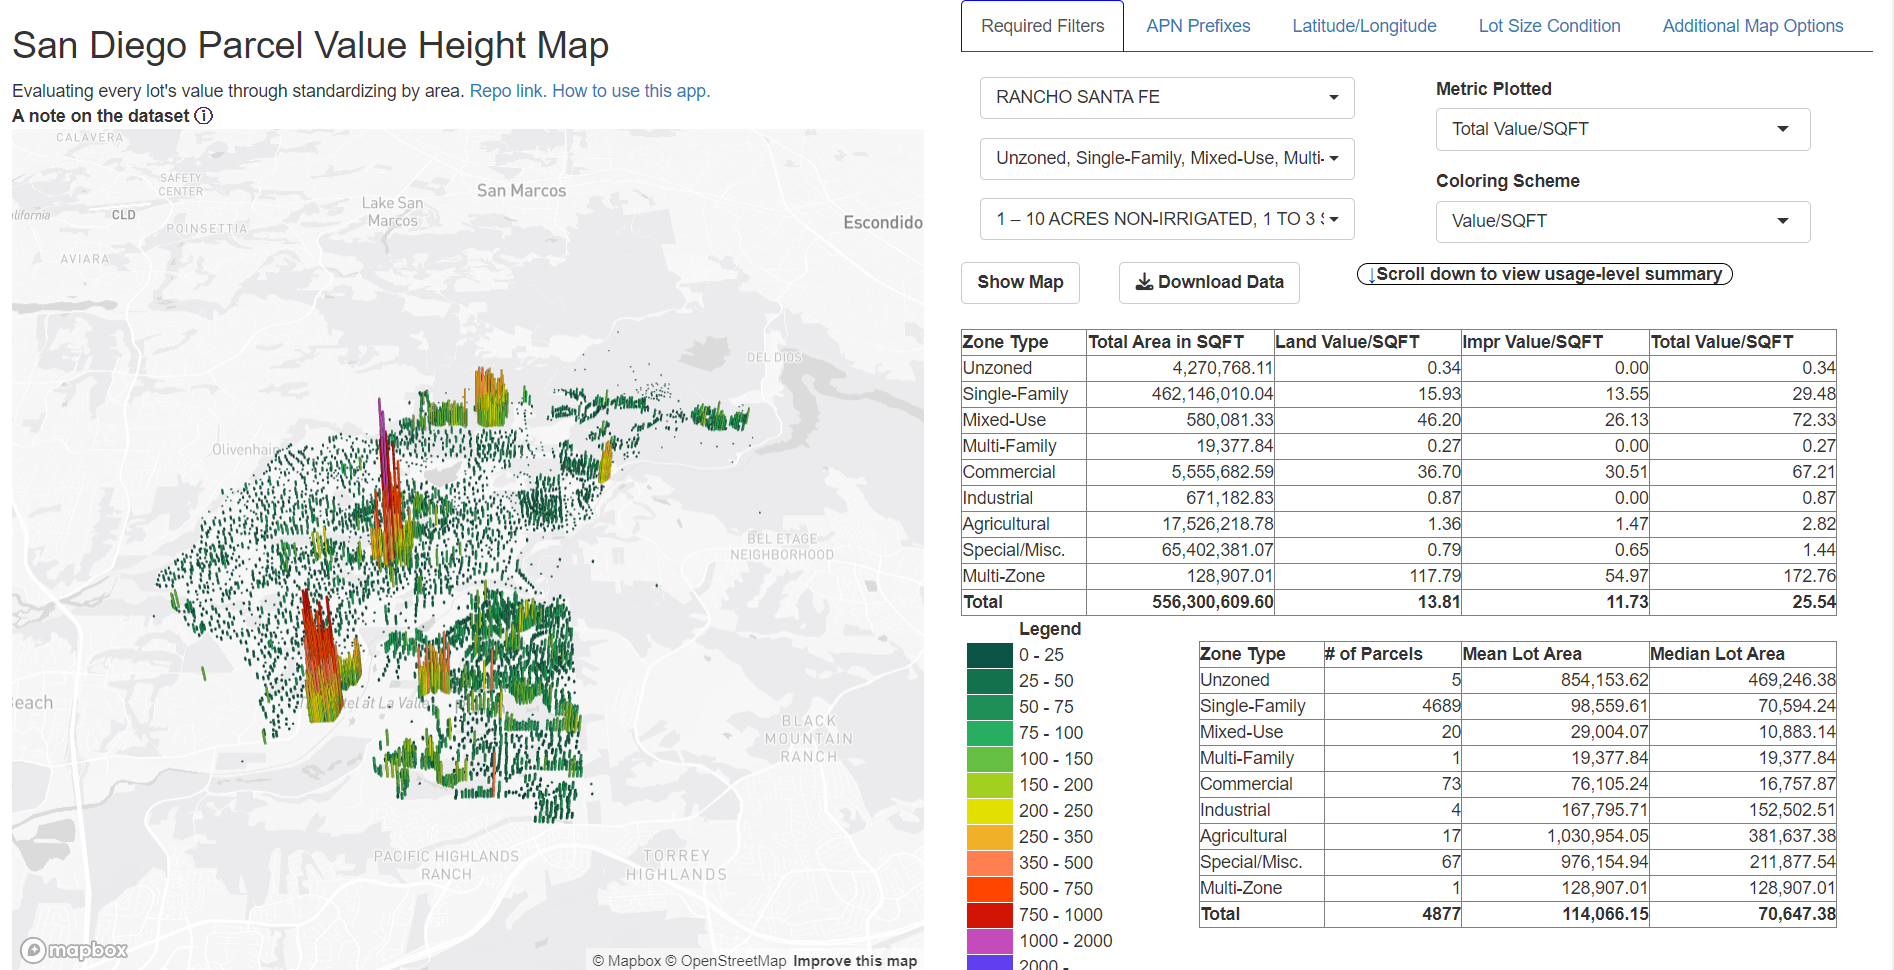 Rancho Santa Fe is assessed at $25.54/sqft. San Diego city is assessed at $84.62/sqft - more than 3 times that of Rancho Santa Fe. Rancho Santa Fe is receiving subsidies that is paid for by citizens in the city. If Rancho Santa Fe was developed to San Diego city’s average value/sqft, we would see an increase of property value equal to:
That’s 47 full Shohei Ohtani contracts, or 5 full lineups of him.
2. Comparing the two sides of Balboa Park
To the west side of Balboa Park is 6th Ave which is full of “luxury” apartments (aka anything built in the past 10 years) whom white homeowners keep telling me makes housing unaffordable (I’m sure they live in very affordable homes) and will block the sun (because it is common knowledge that the sun rests on second floor). To the east of Balboa Park are a bunch of single family homes in North and South Park where a lot of these homeowners live:
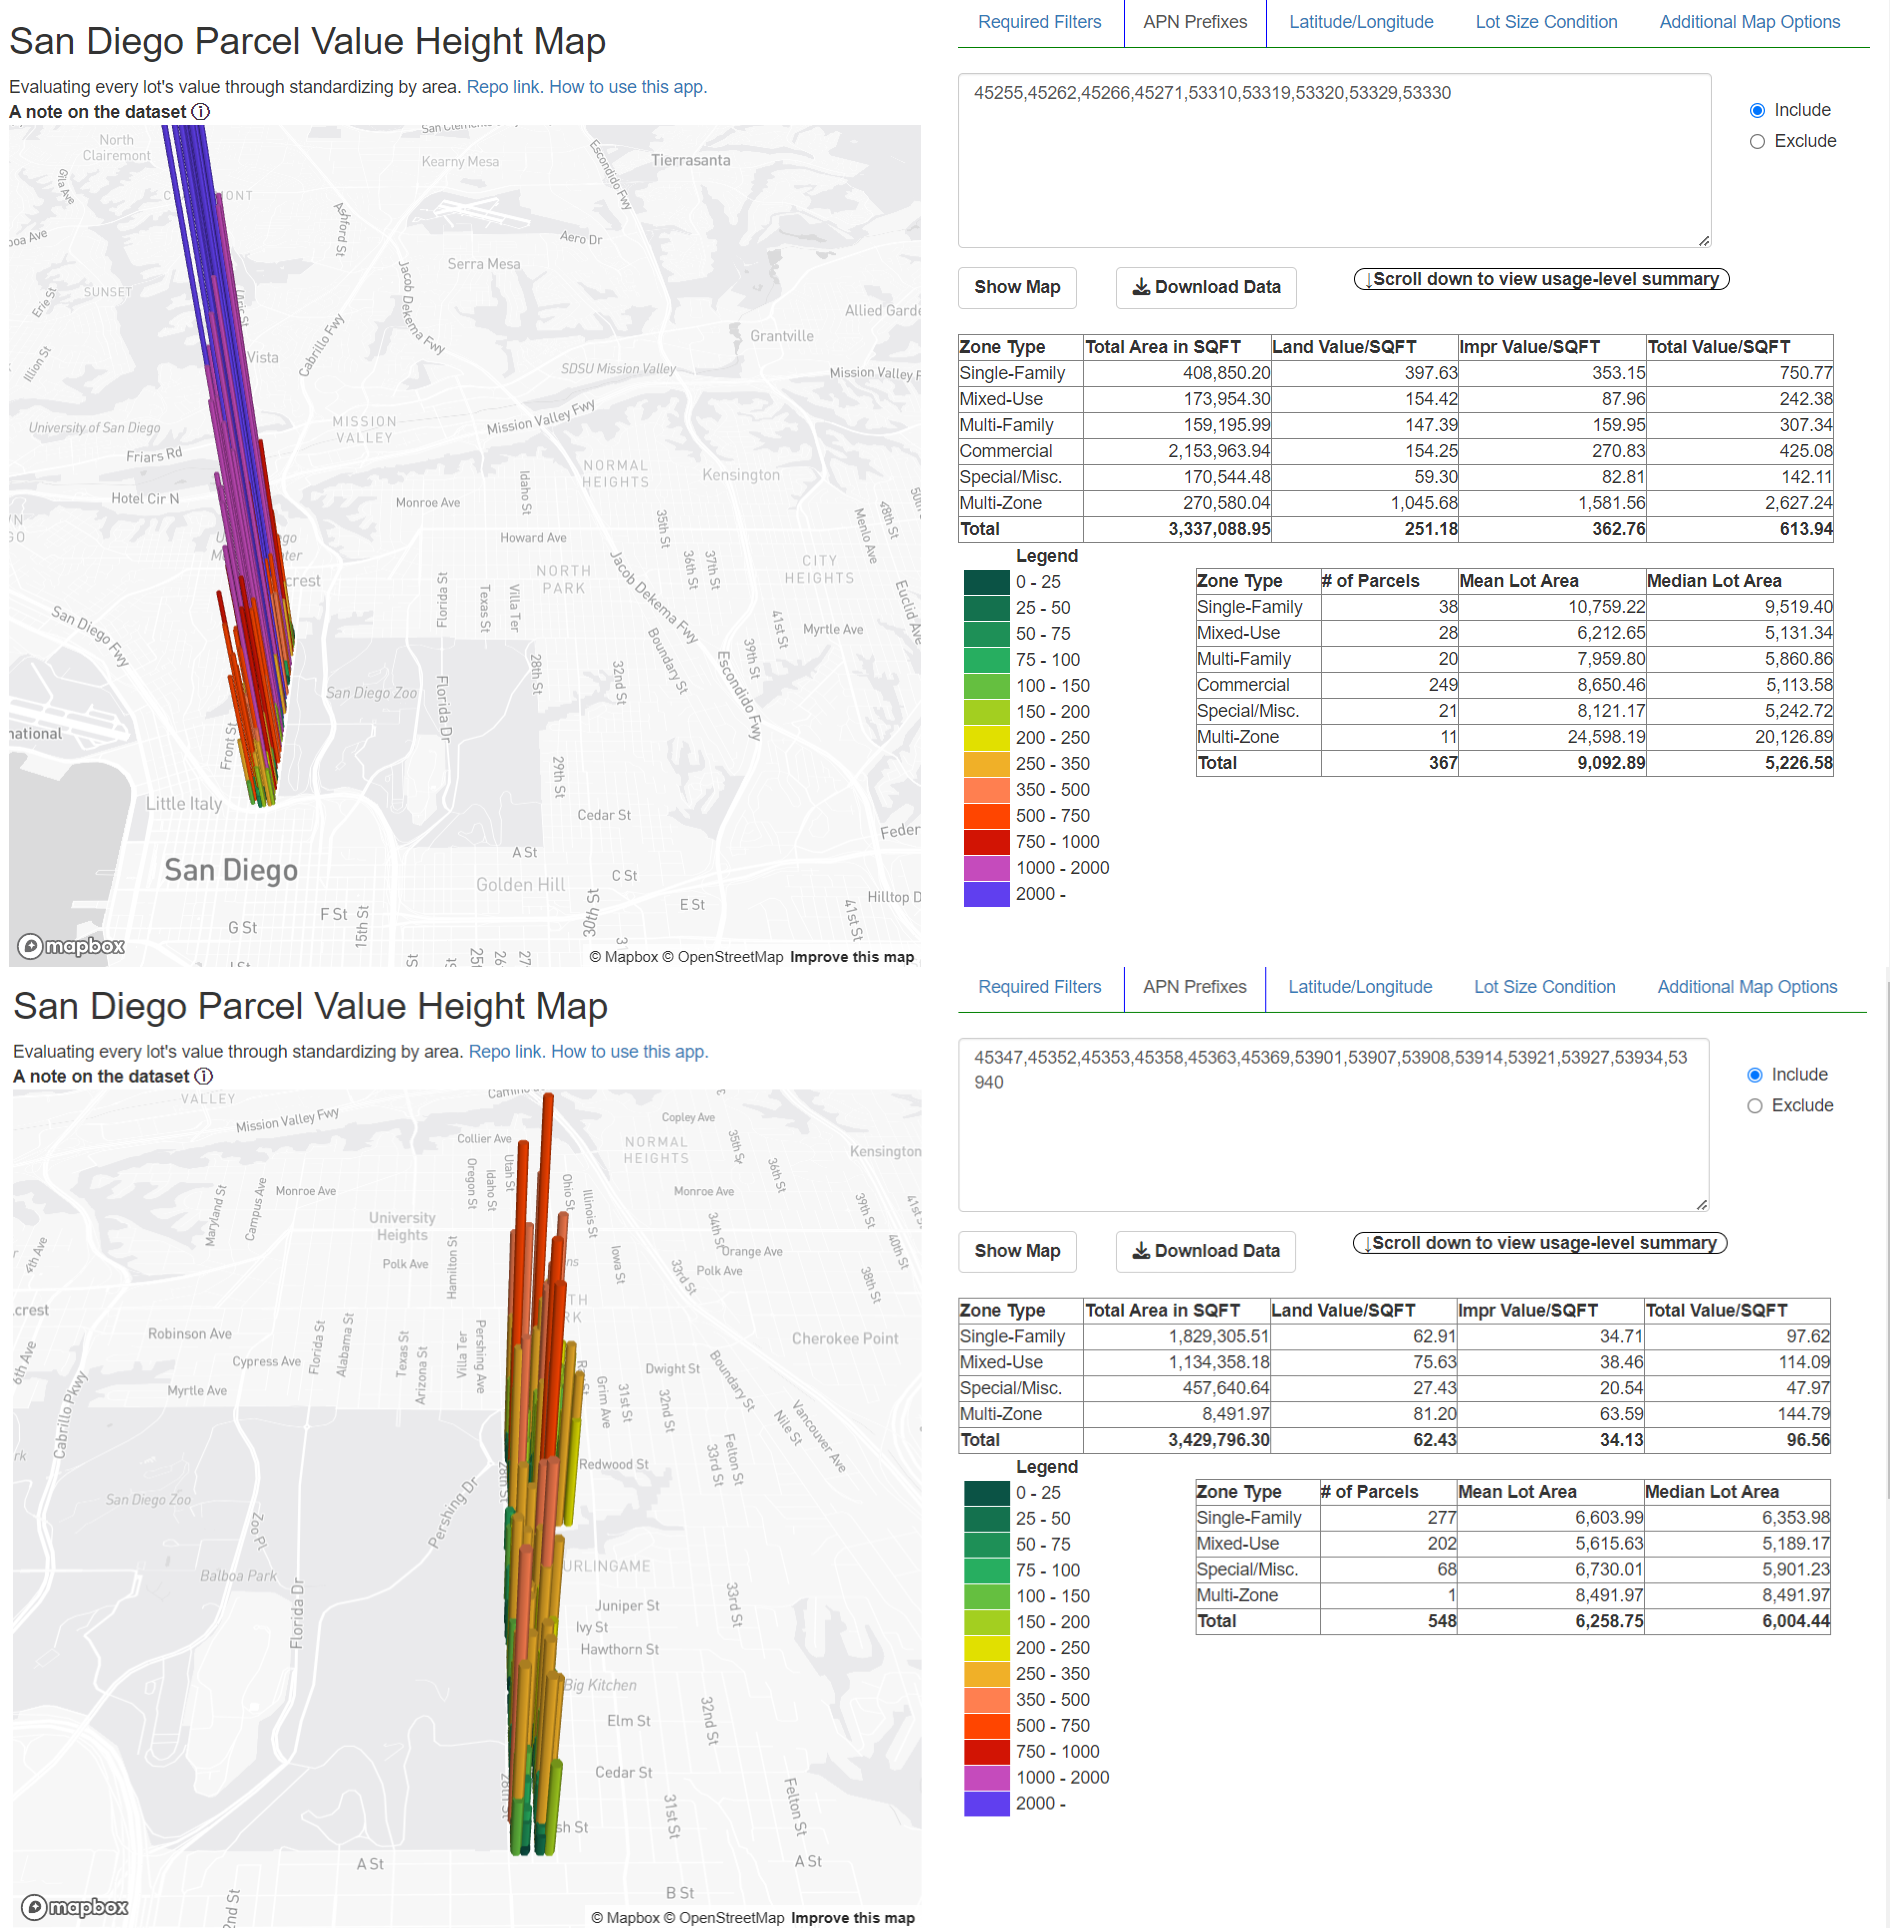 The west side apartments full of million dollar, unaffordable condos are assessed at 6 times more than the east side 1.5 million dollar, affordable houses. The difference in property value is around $1.76 billion - or $17.6 million dollars of property tax income every year. It’s obvious which side is more affordable for the local government
History of edits:
- Change button UI to be more user-friendly (8/17)
- Add tooltip functionality to show you the address and zoning type of the parcel (8/17)
- Add stacked bar chart showing the table summary of value per sqft (8/20)
- Add apply button so map doesn’t update everytime you change an input (8/20)
- Fixed tooltip bug where the tooltip shows the average value of whole area for that zoning type instead of that specific building (8/24)
- Improved stacked bar chart UI (8/24)
- Expand the analysis to further differentiate the zoning types to building types (detached single family house, duplexes, townhouses, highrises etc.) (8/24)
- Implemented multiple choice selection (8/24)
- Added Color Scheme by value instead of zone (9/2)
- Updated color legend so now it shows the legend based on whether the user selected zone type or value per sqft to color (9/2)
- Add mode of map which shows ROI (total value per sqft - infrastructure cost per sqft) under certain assumptions
- Added filter for parcels based on APN that integrates with the other dropdown menus (2/2)
- Replaced stacked barchart with a further summary of the zoning types. Also added more statistics to the usage type table (2/2)
- Updated with 2024 SANDAG assessments (2/13)
- Updated UI to make it more friendly (2/18)
- Added commas to the area values (2/18)
- Add ability to filter by lot size (3/9)
- Add ability to filter by lat/lon with a 0.01 degree radius - around 1 mile (3/12)
- Add ability to download data of selected parcels in map (03/30)
- Replaced Parcel with Lot in tables for clarity (03/30)
- Disabled buttons when the data is loading (03/30)
- Add ability to exclude a certain list of APN prefixes in the APN prefix tab in addition to current functionality that filters based on these APN prefixes (04/09)
- Add sqrt mode to shrink downtown for easier comparison and 100x mode to better plot agriculture communities where land is cheap (04/15)
- Edited map settings so now user can freely choose height multiplier (04/16)
- Auto-centers map at the mean lat and lon of mapped parcels (04/16)
- Add 2D mode (04/17)
- Added error message if user does not select city/community, zoning, and usage (04/17)
- Changed column to 6 sides instead of 20. Now the map runs more smoothly (04/17)
- Added option to include non-taxable parcels and parcels with 0 value (05/07)
- Added CPAs for San Diego city parcels. Now when you select “SAN DIEGO” in the city/community picker, a new picker will appear asking you to select which San Diego CPA to search for (5/12)
- Updated non San Diego City community designations with official borders instead of Assessor records (5/16)
- Fixed bug where Natural Resources parcels are not included in the dashboard (5/16)
- Fixed bug where parcels with both taxable and tax-exempt subparcels have their parcels double-counted when showing both taxable and tax-exempt parcels (05/26)
- Added “Select All Zones and Uses” button as a shortcut (06/20)
- Added error and warning messages to when San Diego city is selected but no community is selected (06/23)
- Moved SAN DIEGO to the top of the city list since it’s so commonly used (07/03)
- Rearranged lat/long and lot size tabs to an “Additional Filter” tab so I can add other options in the future (08/29)
- Updated lat/long and lot size tabs to fit the new tab format better. Now I can add other filter options (09/03)
- Added value based filtering, per parcel or per SQFT (09/19)
- Reorganized data to make it easier to read. Added address for the parcels. If a parcel contains multiple subparcels, all addresses of the subparcels areprinted (09/22)
- Reorganized additional map options and added map option to show the type of information displayed when highlight a parcel. By default, everything is shown. (09/24)
- Added option to select how many characters to show when printing address. Default is 100 (09/25)
- Added option to filter by address (09/29)
- Improved UI. Now the UI is also more friendly on mobile (10/23)
- Added ability to search for multiple addresses in address filter (12/26)
- Expand address filter capability by allowing to filter by multiple addresses
- Reorganize usage options
- Add ability to read in a file of APNs - currently not working on it since you already can copy/paste a list of APNs into the APN section. I might work on this later
- Add ability to show average value of surrounding parcels of a parcel (likely in a certain radius) - currently can do it with lat/long
Need help with:
- Optimizing the dashboard so it costs less to run on GCP
- Add loading tooltips when rendering the map to improve UI (basic Shiny capabilities cannot cover deck.gl maps)
- Plot the parcels on their actual parcel map since the parcel shapefile is too large for my computer to run
- Find a way to implement “reverse mode” - highlighting parcels with a low value per sqft
- Explore other color schemes
- Find other data sources where zoning, land use, and land unit data are more accurate